. 2009 Dec;3(6):441-60.
doi: 10.2976/1.3266062. Epub 2009 Dec 15.

Drosophila morphogenesis: tissue force laws and the modeling of dorsal closure

Drosophila morphogenesis: tissue force laws and the modeling of dorsal closure

Anita T Layton et al. HFSP J. 2009 Dec.

Abstract

Dorsal closure, a stage of Drosophila development, is a model system for cell sheet morphogenesis and wound healing. During closure, two flanks of epidermal tissue progressively advance to reduce the area of the eye-shaped opening in the dorsal surface, which contains amnioserosa tissue. To simulate the time evolution of the overall shape of the dorsal opening, we developed a mathematical model, in which contractility and elasticity are manifest in model force-producing elements that satisfy force-velocity relationships similar to muscle. The action of the elements is consistent with the force-producing behavior of actin and myosin in cells. The parameters that characterize the simulated embryos were optimized by reference to experimental observations on wild-type embryos and, to a lesser extent, on embryos whose amnioserosa was removed by laser surgery and on myospheroid mutant embryos. Simulations failed to reproduce the amnioserosa-removal protocol in either the elastic or the contractile limit, indicating that both elastic and contractile dynamics are essential components of the biological force-producing elements. We found it was necessary to actively upregulate forces to recapitulate both the double and single-canthus nick protocols, which did not participate in the optimization of parameters, suggesting the existence of additional key feedback mechanisms.


Figures

Figure 1
Figure 1. Confocal fluorescent images of native and perturbed dorsal closure in embryos that express GFP-moe.
As described elsewhere (Kiehart et al., 2000), such embryos are considered wild-type unless they carry additional mutations [as in (F)]. Nevertheless, they carry the sGMCA transgene that encodes GFP-moe and the mini-whitewt transgene for eye color, a genetic marker used in the selection of germ line transformants. They are also homozygous for white (eye color) at the endogenous white locus. They can be maintained as a homozygous stock and undergo embryonic development normally. (A) An image of the dorsal surface of a closure staged embryo showing key biological tissues and structures (AS, amnioserosa; LE, lateral epidermis). Time-lapsed images of: (B) a native (i.e., not laser-perturbed) embryo; (C) an embryo with laser cuts to multiple locations designed to compromise the force contributed by the amnioserosa (amnioserosa-removal protocol); (D) an embryo with alternating laser cuts near each canthus to compromise zipping (double-canthus nicking protocol); (E) an embryo with repeated laser cuts compromising zipping near only the posterior canthus (single-canthus nicking protocol); and (F) an embryo homozygous for a null mutation in myospheroid, which encodes the βPS integrin subunit. Black lines in (B)–(E) indicate the targeting of laser incisions; elapsed time commences with the first image taken in (B)–(F). (B)–(F) are modified from Fig. 1 in Hutson et al. (2003) such that anterior is to the left in all figures. A scale bar in (A) is 50 μm and in B (bottom panel) is 50 μm [it applies to all panels in (B)–(F)].
Figure 2
Figure 2. Geometry and forces of dorsal closure.
Labeled schematics are of (A), the entire dorsal opening, and of (B), a segment of leading edge∕purse string.
Figure 3
Figure 3. Dorsal closure in simulated embryos using the straight-line force-velocity relationship.
Time evolution of (A) a native embryo; (B) an embryo without any force contribution from the amnioserosa; (C) an embryo with zipping inhibited at both canthi; (D) an embryo with zipping inhibited only at the posterior canthus; and (E) a myospheroid mutant embryo, simulated by reduced zipping rates at both canthi. These simulations correspond to experimental observations shown in panels (B)–(F) in Fig. 1. Time progresses from top to bottom in 630 s steps for all simulated embryos. Each column extends for 3780 s.
Figure 4
Figure 4. Simulated embryos using the hyperbolic force-velocity relationship.
As in Fig. 3, time evolution of (A) a native embryo; (B) an embryo without any force contribution from the amnioserosa; (C) an embryo with zipping inhibited at both canthi; (D) an embryo with zipping inhibited only at the posterior canthus; and (E) a myospheroid mutant embryo, simulated by reduced zipping rates at both canthi. These simulations correspond to experimental observations shown in panels (B)–(F) of Fig. 1. Time progresses from top to bottom in 630 s steps for all simulated embryos. Each column extends for 3780 s.
Figure 5
Figure 5. A schematic for a biological force-producing element.
Each element consists of an elastic element (i.e., a spring) in series with two elements, a viscous element (dash-pot) and a force-generating element (schematic of bipolar myosin filaments bridging antipolar actin filaments) in parallel with one another.
Figure 6
Figure 6. (A) Schematic of two hypothetical force-velocity relationships.
(B) and (C) The model optimized, straight-line (solid line), and hyperbolic (dashed line) force-velocity relationships are shown for σAS (panel B) and T (panel C).
Figure 7
Figure 7. A schematic of the optimization algorithm.
It includes (A) user provided bounds for each parameter (Table 3) and user provided estimates within the bounds to seed the initial (B) estimate of the parameter set. The optimization of the parameter set is built around two computational loops. The (B)–(J) outer loop refines the parameter set. When the (J) penalty function converges, the algorithm (K) reports the optimized parameter set. The (E)–(I) inner loop iterates through developmental time. Given (B) either the initial seed or an updated estimate for the parameter set, the algorithm then (C) seeds initial values for h (corresponding to the first confocal image of staged embryos) and σAS and T (both determined by the force ladder). The next step is to (D) calculate spatial rates of change for the variables h and ds in order to use (E) model equations 14, 19, 20 to calculate the location of the leading edges. The next steps are to (F) calculate temporal rates of change in h and ds, (G) update the spatial rates of change, and then (H) use model Eqs. 10, 12 to update the values for σAS and T. The decision step (I) in effect steps this process throughout developmental time (from computational time 0 to t5μm). Once the time progression loop has been completed, the next decision step (J) tests the convergence of the penalty function ϕ. The parameter optimization loop is repeated until convergence of the penalty function.
Figure 8
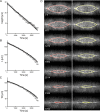
Figure 8. Comparison between simulations and experimental data for a native embryo.
(A)–(C) Plots of key quantitative measures of simulated dorsal closure based on straight-line (solid line) or hyperbolic (dashed line) force-velocity relationships are compared with experimental data (open circles). (A) The distance between the symmetry point and the dorsal midline, h; (B) the contour length of one of the two purse strings, L; and (C) the canthus-to-canthus distance, W, are plotted versus time. (D) Simulated embryos using the straight-line (red) and the hyperbolic force-velocity relationship (yellow) are superimposed on confocal fluorescent images of native embryo that express GFP-moe.
Figure 9
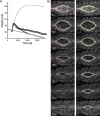
Figure 9. Comparison between simulations and experimental data for an amnioserosa-removal protocol.
(A) Simulations of the amnioserosa-removal protocol based on purely elastic (gray line), purely contractile (gray dashed line), or combined elastic and contractile (black line) models compared with experimental data (open circles). Simulation of native embryo (black dashed line) is shown as a reference. Both purely elastic and purely contractile models fail to show good agreement with experimental data. The model based on both elastic forces and actively contractile forces account for experimental data during the bulk of closure. (B) Simulated embryos using two examples of combined elastic and contractile models, wehre the straight-line (red) and the hyperbolic force-velocity relationship (yellow) are superimposed on confocal fluorescent images of an embryo following the amnioserosa-removal protocol.

References

    1. Arfken, G B (1985). “The method of steepest descents.” Mathematical Methods for Physicists, Academic, Orlando, FL, pp. 428–436.
    1. Bloor, J W, and Kiehart, D P (2002). “Drosophila RhoA regulates the cytoskeleton and cell-cell adhesion in the developing epidermis.” Development DEVPED 129, 3173–3183. - PubMed
    1. Brown, N H, Gregory, S L, and Martin-Bermudo, M D (2000). “Integrins as mediators of morphogenesis in Drosophila.” Dev. Biol. DEBIAO 223, 1–16.10.1006/dbio.2000.9711 - DOI - PubMed
    1. Colombelli, J, Besser, A, Kress, H, Reynaud, E G, Girard, P, Caussinus, E, Haselmann, U, Small, J V, Schwarz, U S, and Stelzer, E H (2009). “Mechanosensing in actin stress fibers revealed by a close correlation between force and protein localization.” J. Cell Sci. 122, 1665–1679.10.1242/jcs.042986 - DOI - PubMed
    1. See EPAPS Document No. E-HJFOA5-3-008907 for supplemental material. This document can be reached through a direct link in the online’s HTML reference section or via the EPAPS homepage (http://www.aip.org/pubservs/epaps.html).

LinkOut - more resources