

Demand equations for qualitatively different foods under fixed-ratio schedules: a comparison of three data conversions
- PMID: 20514164
- PMCID: PMC2771669
- DOI: 10.1901/jeab.2009.92-305
Demand equations for qualitatively different foods under fixed-ratio schedules: a comparison of three data conversions
Abstract
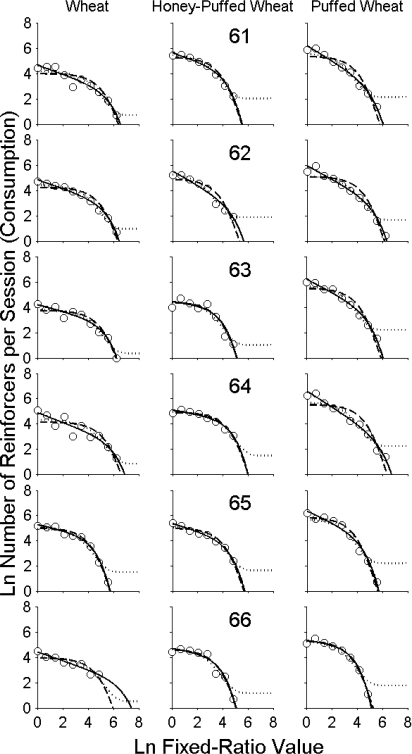
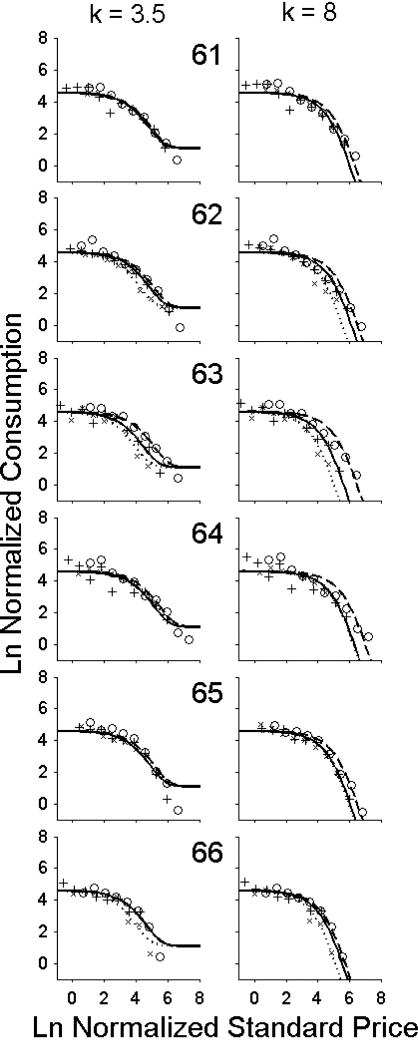
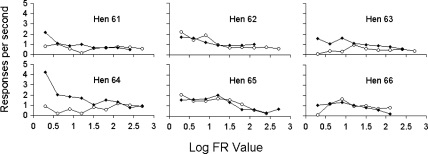
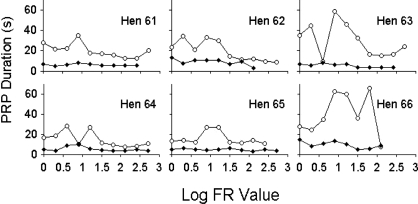
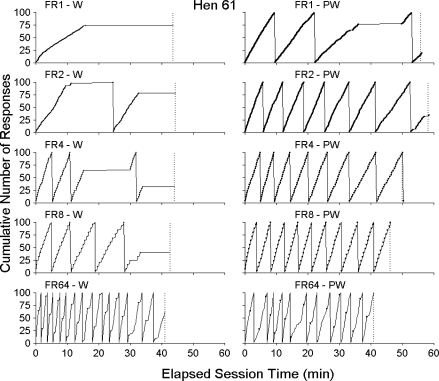
Concurrent schedules were used to establish 6 hens' preferences for three foods. The resulting biases suggested wheat was preferred over honey-puffed and puffed wheat, and puffed wheat was the least preferred food. The hens then responded under fixed-ratio schedules for each food in 40-min (excluding reinforcer time) sessions, with the response requirement doubling each session until no reinforcers were received. At the smaller ratios, the less preferred the food, the faster the hens' overall response rates (mainly as a result of shorter postreinforcement pauses) and the more reinforcers they received. The relations between the logarithms of the number of reinforcers obtained (consumption) and the response ratio (price) were well fitted by curvilinear demand functions. Wheat produced the smallest initial consumption (ln L), followed by honey-puffed and puffed wheat, respectively. The response requirement at which the demand functions predicted maximal responding (P(max)) were larger for wheat than for the other foods. Normalizing consumption and price, as suggested by Hursh and Winger (1995), moved the data for the three foods towards a single demand function; however, the P(max) values were generally largest for puffed wheat. The results of normalization, as suggested by Hursh and Silberberg (2008), depended on the k value used. The parameter k is related to the range of the data, and the same k value needs to be used for all data sets that are compared. A k value of 8.0 gave significantly higher essential values (smaller alpha values) for puffed wheat as compared to honey-puffed wheat and wheat, and the P(max) values, in normalized standard price units, were largest for puffed wheat. Normalizing demand by converting the puffed and honey-puffed wheat reinforcers to wheat equivalents (by applying the bias parameter from the concurrent-schedules procedure) maintained separate demand functions for the foods. Those for wheat had the smallest rates of change in elasticity (a) and, in contrast to the other analyses, the largest P(max) values. Normalizing demand in terms of concurrent-schedule preference appears to have some advantages and to merit further investigation.
Keywords: behavioral economics; concurrent schedules; demand functions; domestic hens; fixed-ratio schedules; key peck; magnitude-of-reinforcer; normalization; reinforcer quality.
Figures

Similar articles
-
Reinforcer magnitude and demand under fixed-ratio schedules with domestic hens.Behav Processes. 2014 Mar;103:199-210. doi: 10.1016/j.beproc.2013.12.013. Epub 2014 Jan 3. Behav Processes. 2014. PMID: 24393654
-
Reinforcer quality matters: A test of the Mathematical Principles of Reinforcement with domestic hens (Gallus gallus domesticus).J Exp Anal Behav. 2019 Jul;112(1):88-96. doi: 10.1002/jeab.538. Epub 2019 Jun 28. J Exp Anal Behav. 2019. PMID: 31250443
-
The effects of reinforcer magnitude in the preceding and upcoming ratios on between-ratio pausing in multiple, mixed, and single fixed-ratio schedules.J Exp Anal Behav. 2017 Nov;108(3):414-432. doi: 10.1002/jeab.290. Epub 2017 Nov 15. J Exp Anal Behav. 2017. PMID: 29139112
-
Revealed preference between reinforcers used to examine hypotheses about behavioral consistencies.Behav Modif. 2000 Jul;24(3):411-24. doi: 10.1177/0145445500243007. Behav Modif. 2000. PMID: 10881385 Review.
-
Hidden equivalence in the operant demand framework: A review and evaluation of multiple methods for evaluating nonconsumption.J Exp Anal Behav. 2022 Jan;117(1):105-119. doi: 10.1002/jeab.724. Epub 2021 Nov 19. J Exp Anal Behav. 2022. PMID: 34797575 Review.
Cited by
-
Effects of economy type and nicotine on the essential value of food in rats.J Exp Anal Behav. 2012 Mar;97(2):183-202. doi: 10.1901/jeab.2012.97-183. J Exp Anal Behav. 2012. PMID: 22389525 Free PMC article.
-
The effects of session length on demand functions generated using FR schedules.J Exp Anal Behav. 2011 May;95(3):289-304. doi: 10.1901/jeab.2011.95-289. J Exp Anal Behav. 2011. PMID: 21547068 Free PMC article.
-
Effects of a signaled delay to reinforcement in the previous and upcoming ratios on between-ratio pausing in fixed-ratio schedules.J Exp Anal Behav. 2012 Nov;98(3):295-309. doi: 10.1901/jeab.2012.98-295. J Exp Anal Behav. 2012. PMID: 23144507 Free PMC article.
References
-
- Christensen C.J, Kohut S.J, Handler S, Silberberg A, Riley A.L. Demand for food and cocaine in Fischer and Lewis rats. Behavioral Neuroscience. 2009;123:165–171. - PubMed
-
- Christensen C.J, Silberberg A, Hursh S.R, Huntsberry M.E, Riley A.L. Essential value of cocaine and food in rats: Tests of the exponential model of demand. Psychopharmacology. 2008;198:221–229. - PubMed
Publication types
MeSH terms
LinkOut - more resources
Full Text Sources
