

Constant pH replica exchange molecular dynamics in biomolecules using a discrete protonation model
- PMID: 20514364
- PMCID: PMC2877402
- DOI: 10.1021/ct900676b
Constant pH replica exchange molecular dynamics in biomolecules using a discrete protonation model
Abstract
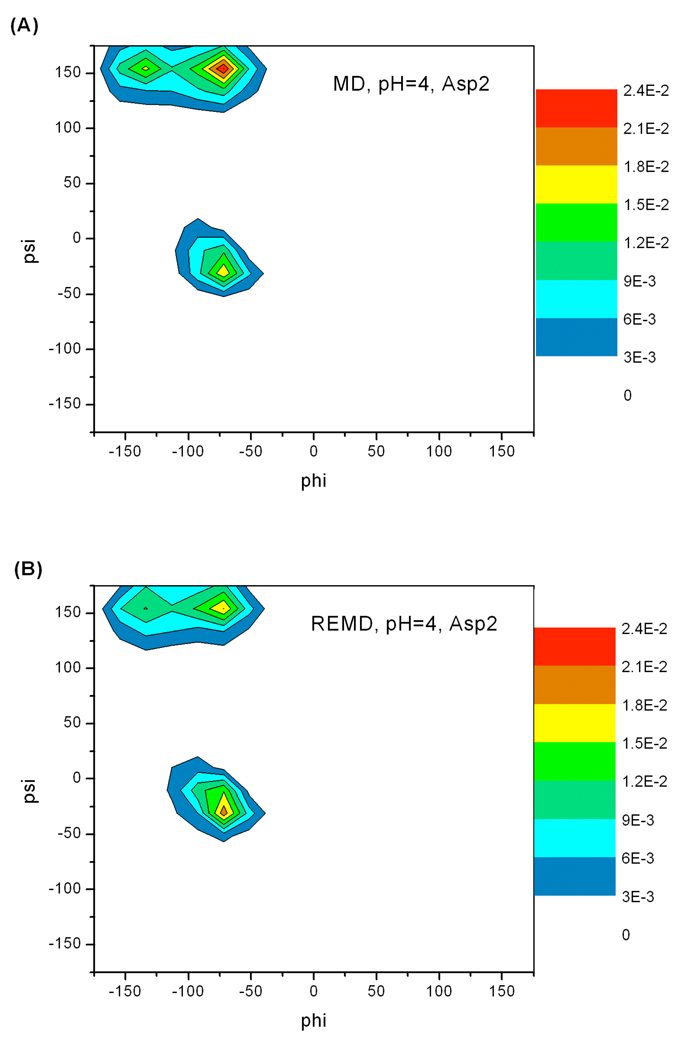
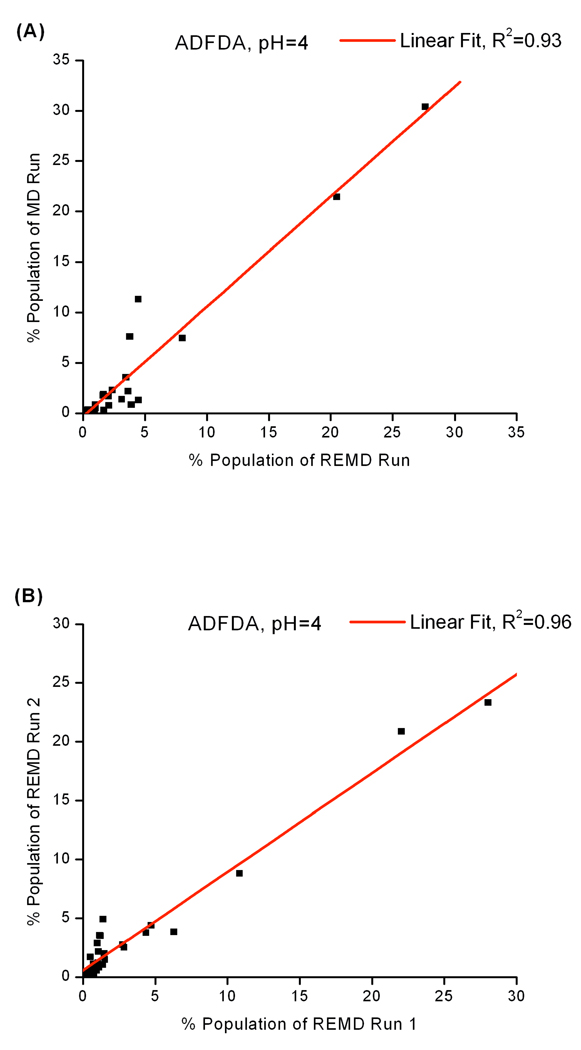
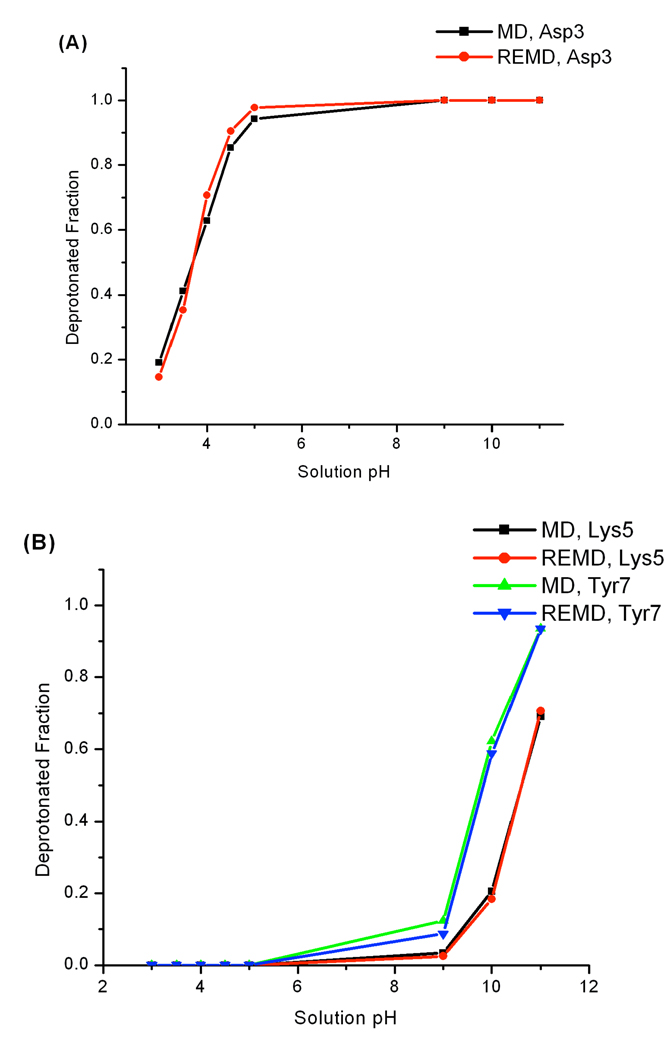
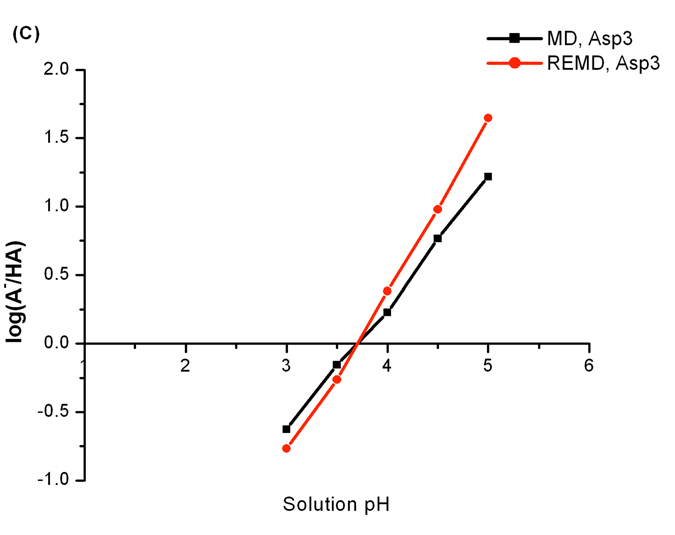
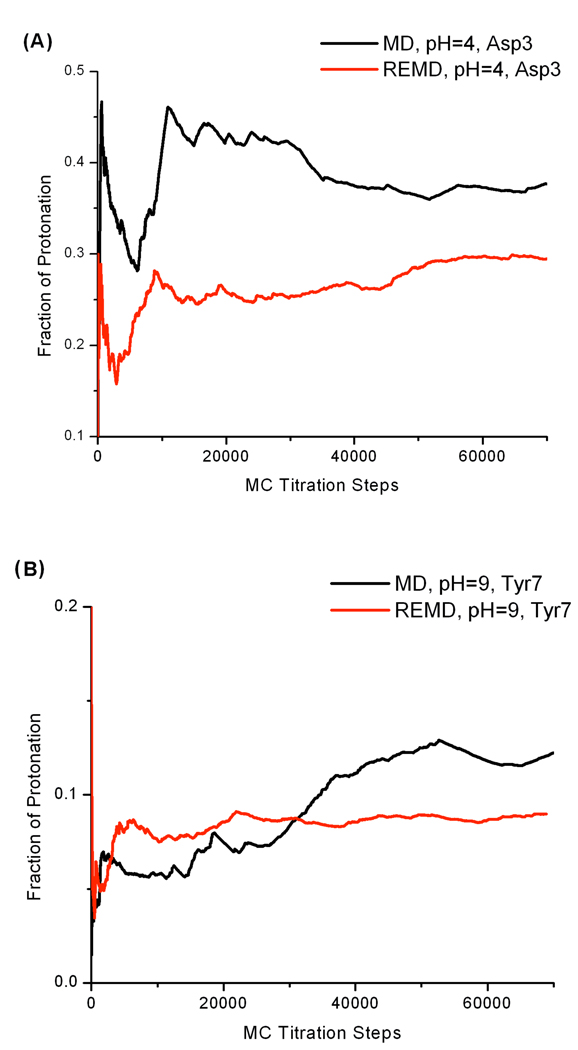
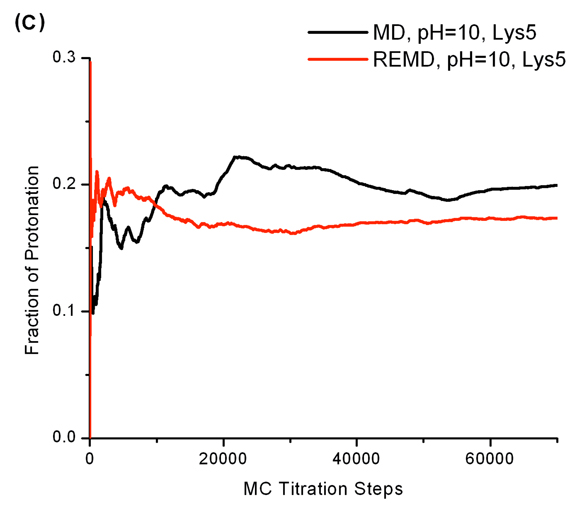
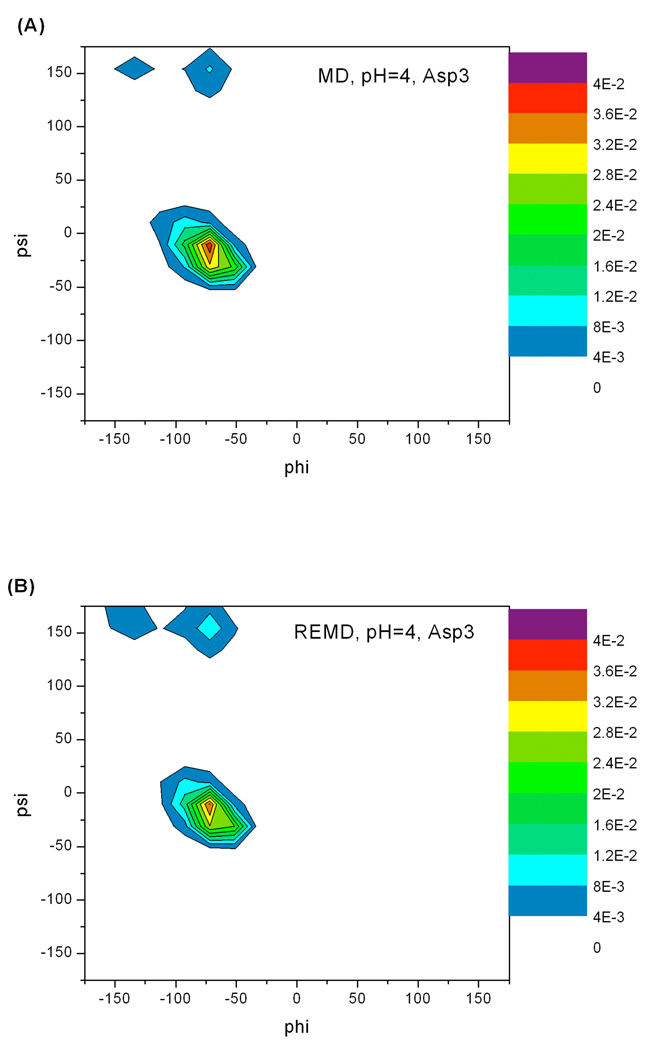
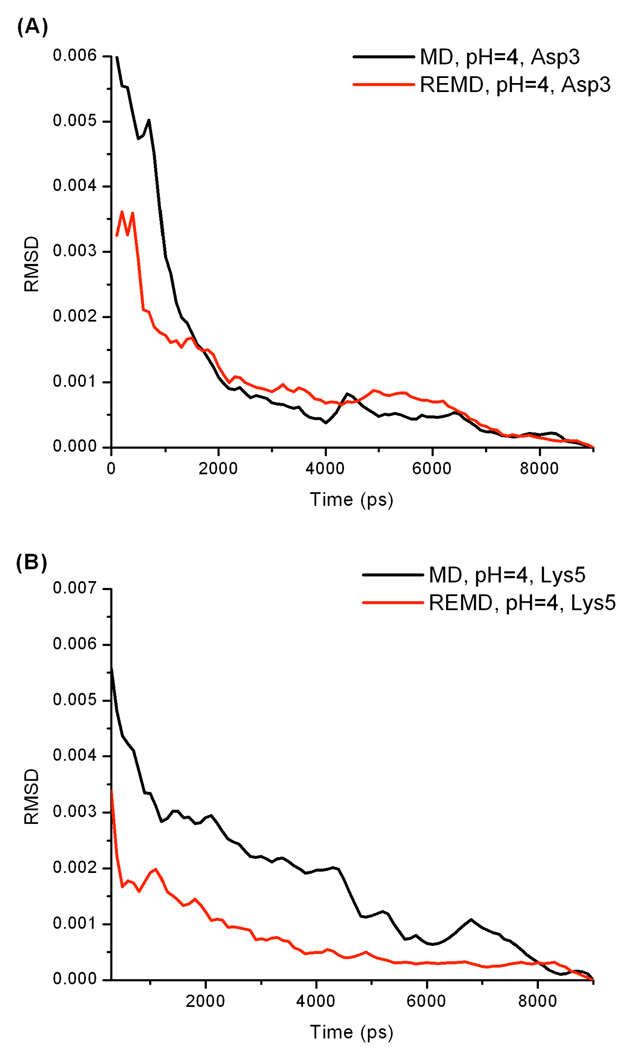
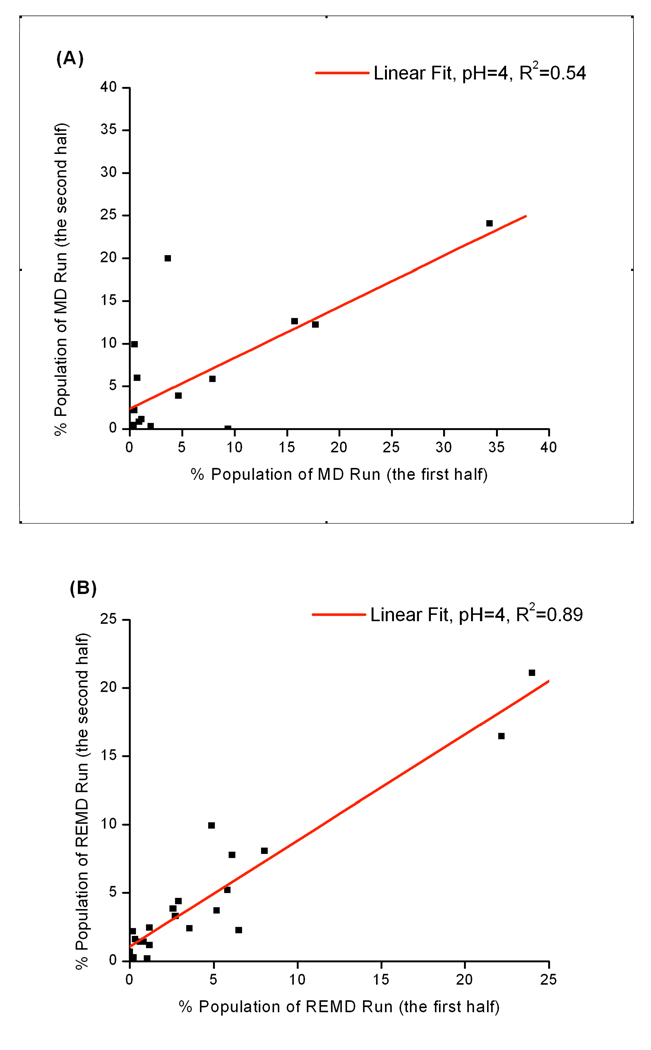
A constant pH replica exchange molecular dynamics (REMD) method is proposed and implemented to improve coupled protonation and conformational state sampling. By mixing conformational sampling at constant pH (with discrete protonation states) with a temperature ladder, this method avoids conformational trapping. Our method was tested and applied to seven different biological systems. The constant pH REMD not only predicted pKa correctly for small, model compounds but also converged faster than constant pH molecular dynamics (MD). We further tested our constant pH REMD on a heptapeptide from ovomucoid third domain (OMTKY3). Although constant pH REMD and MD produced very close pKa values, the constant pH REMD showed its advantage in the efficiency of conformational and protonation state samplings.
Figures
Similar articles
-
pH-replica exchange molecular dynamics in proteins using a discrete protonation method.J Phys Chem B. 2012 Aug 2;116(30):8805-11. doi: 10.1021/jp303385x. Epub 2012 Jul 17. J Phys Chem B. 2012. PMID: 22694266 Free PMC article.
-
Enhancing Conformation and Protonation State Sampling of Hen Egg White Lysozyme Using pH Replica Exchange Molecular Dynamics.J Chem Theory Comput. 2012 Nov 13;8(11):4393-404. doi: 10.1021/ct300512h. Epub 2012 Sep 14. J Chem Theory Comput. 2012. PMID: 26605601
-
Constant pH Replica Exchange Molecular Dynamics in Explicit Solvent Using Discrete Protonation States: Implementation, Testing, and Validation.J Chem Theory Comput. 2014 Mar 11;10(3):1341-1352. doi: 10.1021/ct401042b. Epub 2014 Feb 5. J Chem Theory Comput. 2014. PMID: 24803862 Free PMC article.
-
Influence of various parameters in the replica-exchange molecular dynamics method: Number of replicas, replica-exchange frequency, and thermostat coupling time constant.Biophys Physicobiol. 2018 Aug 8;15:165-172. doi: 10.2142/biophysico.15.0_165. eCollection 2018. Biophys Physicobiol. 2018. PMID: 30250775 Free PMC article. Review.
-
Multiscale implementation of infinite-swap replica exchange molecular dynamics.Proc Natl Acad Sci U S A. 2016 Oct 18;113(42):11744-11749. doi: 10.1073/pnas.1605089113. Epub 2016 Oct 3. Proc Natl Acad Sci U S A. 2016. PMID: 27698148 Free PMC article. Review.
Cited by
-
Enhanced conformational sampling using replica exchange with concurrent solute scaling and hamiltonian biasing realized in one dimension.J Chem Theory Comput. 2015 Jun 9;11(6):2855-67. doi: 10.1021/acs.jctc.5b00243. J Chem Theory Comput. 2015. PMID: 26082676 Free PMC article.
-
Generalized Born Based Continuous Constant pH Molecular Dynamics in Amber: Implementation, Benchmarking and Analysis.J Chem Inf Model. 2018 Jul 23;58(7):1372-1383. doi: 10.1021/acs.jcim.8b00227. Epub 2018 Jul 11. J Chem Inf Model. 2018. PMID: 29949356 Free PMC article.
-
Assessing pH-Dependent Conformational Changes in the Fusion Peptide Proximal Region of the SARS-CoV-2 Spike Glycoprotein.Viruses. 2024 Jul 2;16(7):1066. doi: 10.3390/v16071066. Viruses. 2024. PMID: 39066230 Free PMC article.
-
phbuilder: A Tool for Efficiently Setting up Constant pH Molecular Dynamics Simulations in GROMACS.J Chem Inf Model. 2024 Feb 12;64(3):567-574. doi: 10.1021/acs.jcim.3c01313. Epub 2024 Jan 12. J Chem Inf Model. 2024. PMID: 38215282 Free PMC article.
-
Electrostatics in Computational Biophysics and Its Implications for Disease Effects.Int J Mol Sci. 2022 Sep 7;23(18):10347. doi: 10.3390/ijms231810347. Int J Mol Sci. 2022. PMID: 36142260 Free PMC article. Review.
References
Grants and funding
LinkOut - more resources
Full Text Sources