. 2010 Jun 1:10:249.
doi: 10.1186/1471-2407-10-249.

Nuclear expression of FLT1 and its ligand PGF in FUS-DDIT3 carrying myxoid liposarcomas suggests the existence of an intracrine signaling loop

Affiliations

Nuclear expression of FLT1 and its ligand PGF in FUS-DDIT3 carrying myxoid liposarcomas suggests the existence of an intracrine signaling loop

Mattias K Andersson et al. BMC Cancer. .

Abstract

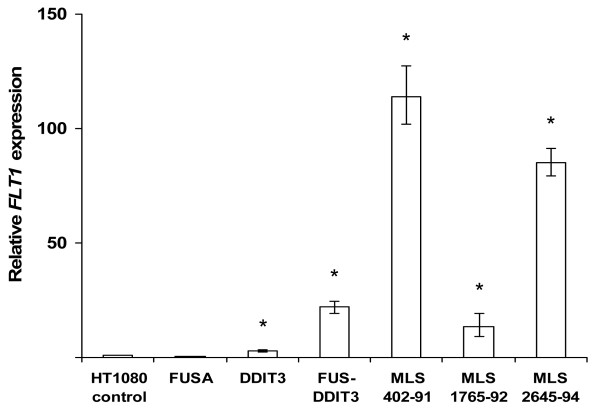
Background: The FUS-DDIT3 fusion oncogene encodes an abnormal transcription factor that has a causative role in the development of myxoid/round-cell liposarcomas (MLS/RCLS). We have previously identified FLT1 (VEGFR1) as a candidate downstream target gene of FUS-DDIT3. The aim of this study was to investigate expression of FLT1 and its ligands in MLS cells.

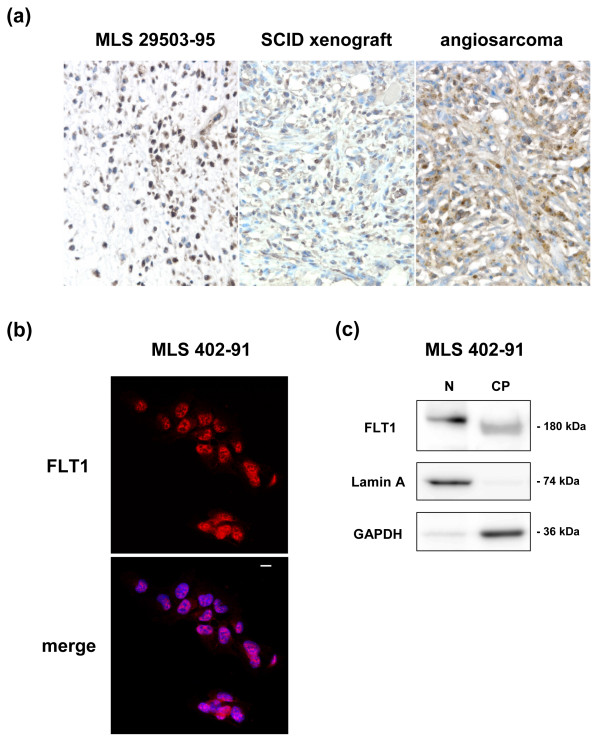
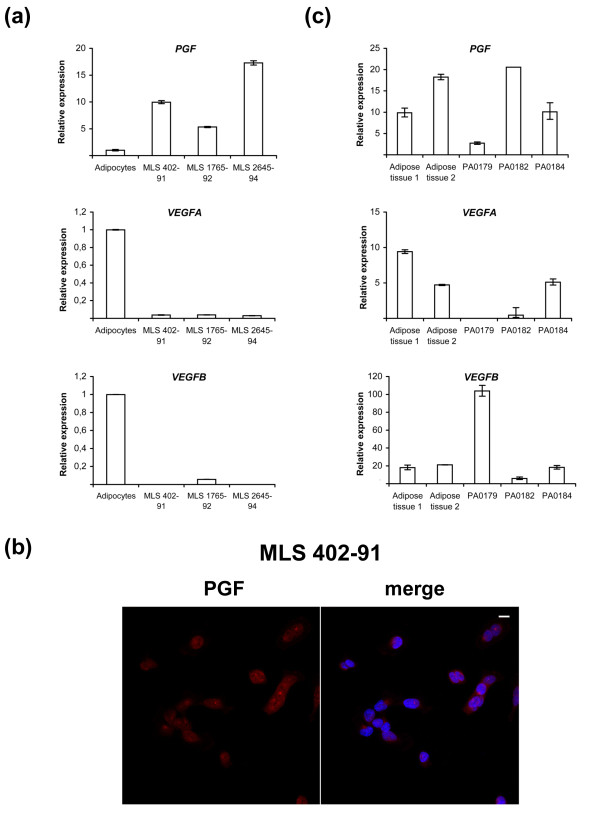
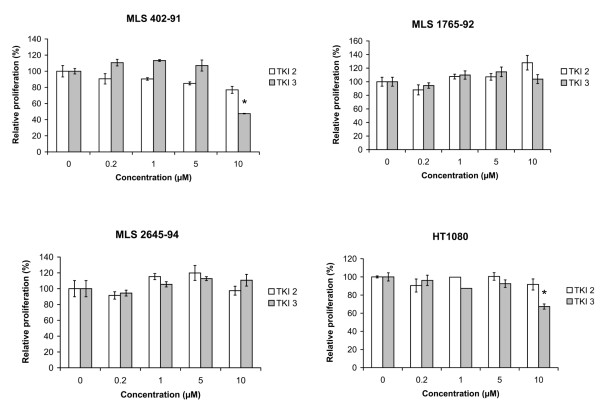
Methods: HT1080 human fibrosarcoma cells were transiently transfected with FUS-DDIT3-GFP variant constructs and FLT1 expression was measured by quantitative real-time PCR. In addition, FLT1, PGF, VEGFA and VEGFB expression was measured in MLS/RCLS cell lines, MLS/RCLS tumors and in normal adiopocytes. We analyzed nine cases of MLS/RCLS and one cell line xenografted in mice for FLT1 protein expression using immunohistochemistry. MLS/RCLS cell lines were also analyzed for FLT1 by immunofluorescence and western blot. MLS/RCLS cell lines were additionally treated with FLT1 tyrosine kinase inhibitors and assayed for alterations in proliferation rate.

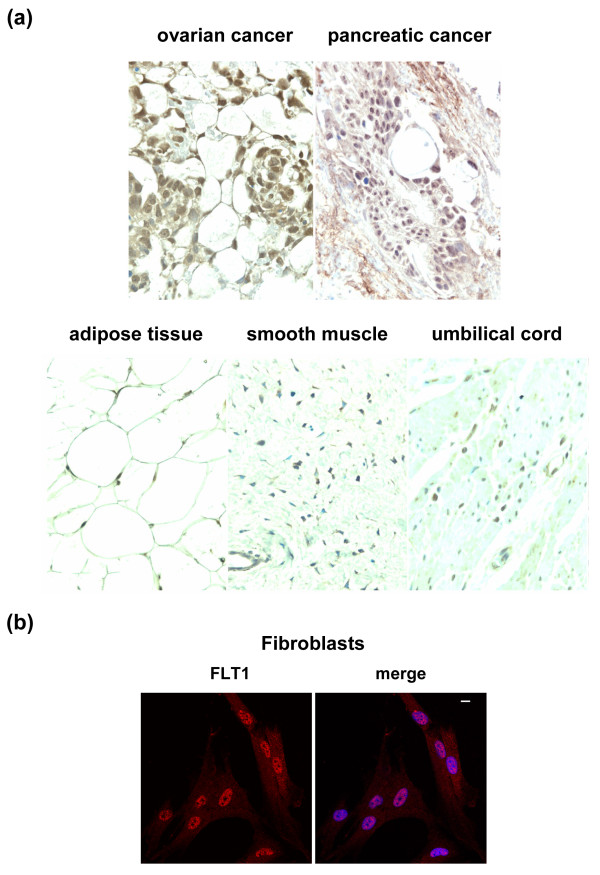
Results: FLT1 expression was dramatically increased in transfected cells stably expressing FUS-DDIT3 and present at high levels in cell lines derived from MLS. The FLT1 protein showed a strong nuclear expression in cells of MLS tissue as well as in cultured MLS cells, which was confirmed by cellular fractionation. Tissue array analysis showed a nuclear expression of the FLT1 protein also in several other tumor and normal cell types including normal adipocytes. The FLT1 ligand coding gene PGF was highly expressed in cultured MLS cells compared to normal adipocytes while the other ligand genes VEGFA and VEGFB were expressed to lower levels. A more heterogeneous expression pattern of these genes were observed in tumor samples. No changes in proliferation rate of MLS cells were detected at concentrations for which the kinase inhibitors have shown specific inhibition of FLT1.

Conclusions: Our results imply that FLT1 is induced as an indirect downstream effect of FUS-DDIT3 expression in MLS. This could be a consequence of the ability of FUS-DDIT3 to hijack parts of normal adipose tissue development and reprogram primary cells to a liposarcoma-like phenotype. The findings of nuclear FLT1 protein and expression of corresponding ligands in MLS and normal tissues may have implications for tissue homeostasis and tumor development through auto- or intracrine signaling.


Figures

Figure 1
Figure 1
Increased FLT1 transcription in FUS-DDIT3 expressing cell lines. Bars show mean relative FLT1 expression by quantitative real-time PCR analysis of three independent biological replicates compared to wild type HT1080 with FLT1 expression set to 1. The geometric mean of ACTB and GAPDH expression was used to normalize FLT1 expression between samples. Error bars show standard error of the mean. Asterisks indicate statistical significance with p < 0.01.
Figure 2
Figure 2
Nuclear FLT1 localization in MLS tumors and cultured MLS cells. (a) Immunohistochemical analysis of FLT1 expression in tissue sections of a representative MLS tumor and in an MLS 402-91 SCID mouse xenograft. Brown staining indicates FLT1 expression while blue staining shows negatively staining nuclei. Cytoplasmic FLT1 expression in angiosarcoma was used as a positive control. (b) FLT1 expression in cultured MLS 402-91 cells analyzed by immunofluorescence. The merge image shows nuclear DAPI staining in blue. Scale bar indicates 10 μm. (c) Western blot analysis of nuclear (N) and cytoplasmic (CP) fractions of MLS 402-91 cells. Lamin A was used as a control for the nuclear fraction and GAPDH was used as control for the cytoplasmic fraction.
Figure 3
Figure 3
Nuclear FLT1 expression in malignant and normal cells. (a) Immunohistochemical analysis of FLT1 expression in cancerous and normal tissues. Brown staining indicates FLT1 expression while blue staining shows negatively staining nuclei. (b) Immunofluorescence analysis of FLT1 expression in cultured human fibroblasts. The merge image shows nuclear DAPI staining in blue. Scale bar indicates 10 μm.
Figure 4
Figure 4
Quantitative real-time PCR analysis of PGF, VEGFA and VEGFB expression in FUS-DDIT3 expressing cell lines and tumors. (a) Bars show fold difference in ligand expression compared to adipocytes with a relative expression set to 1. Error bars show standard error of the mean (b) Immunofluorescence analysis of PGF expression in MLS 402-91. The merge image shows nuclear DAPI staining in blue. Scale bar indicates 10 μm. (c) Bars show relative expression of ligand mRNA in normal adipose tissue and in three MLS tumors. The geometric mean of ACTB and GAPDH expression was used to normalize gene expression between samples. Error bars show standard error of the mean.
Figure 5
Figure 5
Proliferation of tumor cells treated with VEGFR tyrosine kinase inhibitors. Cells were treated with indicated concentrations of drugs for 72 hours and relative cell proliferation was assayed in comparison to untreated control cells. Bars show means of three biological replicates and error bars show standard error of the mean. Asterisks indicate significant inhibition of proliferation with p < 0.01.

Similar articles

Cited by

References

    1. Fletcher CDM, Unni KK, Mertens F. World Health Organization Classification of Tumours. Pathology and Genetics of Tumours of Soft Tissue and Bone. IARC Press: Lyon; 2002.
    1. Andersson MK, Stahlberg A, Arvidsson Y, Olofsson A, Semb H, Stenman G, Nilsson O, Aman P. The multifunctional FUS, EWS and TAF15 proto-oncoproteins show cell type-specific expression patterns and involvement in cell spreading and stress response. BMC Cell Biol. 2008;9:37. doi: 10.1186/1471-2121-9-37. - DOI - PMC - PubMed
    1. Aman P, Ron D, Mandahl N, Fioretos T, Heim S, Arheden K, Willen H, Rydholm A, Mitelman F. Rearrangement of the transcription factor gene CHOP in myxoid liposarcomas with t(12;16)(q13;p11) Genes Chromosomes Cancer. 1992;5(4):278–285. doi: 10.1002/gcc.2870050403. - DOI - PubMed
    1. Crozat A, Aman P, Mandahl N, Ron D. Fusion of CHOP to a novel RNA-binding protein in human myxoid liposarcoma. Nature. 1993;363(6430):640–644. doi: 10.1038/363640a0. - DOI - PubMed
    1. Rabbitts TH, Forster A, Larson R, Nathan P. Fusion of the dominant negative transcription regulator CHOP with a novel gene FUS by translocation t(12;16) in malignant liposarcoma. Nat Genet. 1993;4(2):175–180. doi: 10.1038/ng0693-175. - DOI - PubMed

Publication types

MeSH terms