. 2010 Aug 6;285(32):24759-68.
doi: 10.1074/jbc.M109.097881. Epub 2010 Jun 1.

The role of interchain heterodisulfide formation in activation of the human common beta and mouse betaIL-3 receptors

Affiliations

The role of interchain heterodisulfide formation in activation of the human common beta and mouse betaIL-3 receptors

Shamaruh Mirza et al. J Biol Chem. .

Abstract

The cytokines, interleukin-3 (IL-3), interleukin-5 (IL-5), and granulocyte-macrophage colony-stimulating factor (GM-CSF), exhibit overlapping activities in the regulation of hematopoietic cells. In humans, the common beta (betac) receptor is shared by the three cytokines and functions together with cytokine-specific alpha subunits in signaling. A widely accepted hypothesis is that receptor activation requires heterodisulfide formation between the domain 1 D-E loop disulfide in human betac (hbetac) and unidentified cysteine residues in the N-terminal domains of the alpha receptors. Since the development of this hypothesis, new data have been obtained showing that domain 1 of hbetac is part of the cytokine binding epitope of this receptor and that an IL-3Ralpha isoform lacking the N-terminal Ig-like domain (the "SP2" isoform) is competent for signaling. We therefore investigated whether distortion of the domain 1-domain 4 ligand-binding epitope in hbetac and the related mouse receptor, beta(IL-3), could account for the loss of receptor signaling when the domain 1 D-E loop disulfide is disrupted. Indeed, mutation of the disulfide in hbetac led to both a complete loss of high affinity binding with the human IL-3Ralpha SP2 isoform and of downstream signaling. Mutation of the orthologous residues in the mouse IL-3-specific receptor, beta(IL-3), not only precluded direct binding of mouse IL-3 but also resulted in complete loss of high affinity binding and signaling with the mouse IL-3Ralpha SP2 isoform. Our data are most consistent with a role for the domain 1 D-E loop disulfide of hbetac and beta(IL-3) in maintaining the precise positions of ligand-binding residues necessary for normal high affinity binding and signaling.


Figures

FIGURE 1.
FIGURE 1.
A, structure of the βc homodimer. Chain A is green, and chain B is red. Domains of both chain A and B are labeled in green and red text, respectively. The loops of domain 1 and 4 relevant to ligand-receptor interaction, receptor assembly, and structural integrity are labeled in black text. The structure of hβc is taken from Protein Data Bank entry 1gh7. The schematic diagram was drawn using PyMOL (DeLano Scientific LLC). B, schematic models of IL-3Rα SP1 and SP2 isoforms showing structural domains. In human and mouse SP2 isoforms, deletions of 234 and 279 bp, respectively, occur in D1. C, domain 1-domain 4 elbow region of hβc showing the domain 1 D-E loop. Domain 4 from chain A and domain 1 from chain B have been colored green and blue, respectively. The Cys62-Cys67 disulfide is colored yellow, and the D-E loop is labeled in red text. The loops of domains 1 and 4 relevant to ligand-receptor interaction are labeled in black text. The schematic diagram was drawn using PyMOL. D, multispecies alignments of βc covering the region of the domain 1 D-E loop disulfide. Conserved Cys residues are highlighted in yellow, and Cys62 and Cys67 of hβc and Cys67 and Cys73 of βIL-3 are highlighted in purple and in boldface type. The residues between the conserved cysteines (Cys62–Cys67) composing the disulfide motif are highlighted in blue. The critical high affinity ligand binding residues Tyr15 and Tyr21 of hβc and mβIL-3, respectively, are highlighted in red and in boldface type and are well conserved among species. The secondary structure features observed in the βc structure are marked above the sequence; green arrows represent β strands, and red lines represent helical regions. In the alignment, the WSXWS motif and other key ligand binding residues are well conserved. In the figure, only the region of the alignment covering the residues up to 79, 85, and 84 of hβc, βIL-3, and mβc, respectively, is shown.
FIGURE 2.
FIGURE 2.
Growth signaling and cell surface expression properties of C67Ahβc receptor in CTLL2 cells. A, plots depict the percentage of growth in CTLL2 cells stably expressing wild type (wt) or mutant human receptors in response to a serial dilution of growth factor as labeled in the figure. The data shown are representative of data from at least two experiments. B, cell surface expression of wild type hβc or C67Ahβc in stably transfected CTLL2 cells was detected by flow cytometry following the method described under “Experimental Procedures.” Cells stained with only the PE-conjugated antibody were used as a control for each assay (depicted by the gray shaded area).
FIGURE 3.
FIGURE 3.
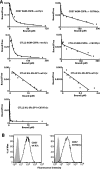
Ligand binding properties of C67Ahβc and its cell surface expression in COS7 cells. A, Scatchard plots of 125I-labeled GM-CSF or hIL-3 hot saturation binding data for COS7 or CTLL2 cells expressing hGM-CSFRα or hIL-3Rα SP1 or hSP2 plus wild type (wt) hβc or C67Ahβc. Each plot in the figure is labeled with the cells used followed by the receptors being measured. Data from a representative hot saturation binding experiment are shown in each plot with the line of best fit determined by co-analysis of data from several binding experiments using LIGAND (39). The derived Kd values are shown in Table 1. Curvilinear plots, such as that in the top left panel, are indicative of two-site binding models, whereas one-site binding models show a linear fit to the data. B, cell surface expression of wild type and mutant hβc in COS7. Cells stained with only the PE-conjugated antibody were used as a control for each assay (depicted by the gray shaded area).
FIGURE 4.
FIGURE 4.
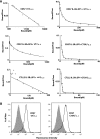
Growth signaling and cell surface expression properties of the C73AβIL-3 receptor in CTLL2 cells. A, proliferation of CTLL2 cells stably expressing mIL-3Rα SP2 or SP1 and wild type (wt) βIL-3 or C73AβIL-3. Cells were grown in a medium supplemented with various concentrations of mIL-3 as indicated for 2 days, and growth was measured in triplicate by [3H]thymidine incorporation in at least two independent experiments. B, cell surface expression of wild type and C73AβIL-3 subunits as detected by flow cytometry following the method described under “Experimental Procedures.” Cells stained with only the PE-conjugated antibody were used as a control for each assay (depicted by the gray shaded area).
FIGURE 5.
FIGURE 5.
mIL-3 binding properties of C73AβIL-3 and cell surface expression in COS cells. A, Scatchard plots of 125I-labeled mIL-3 binding data for COS7 and CTLL2 cells expressing wild type (wt) βIL-3 or C73AβIL-3 with or without mIL-3Rα mSP1 or mSP2. Each plot in the figure is labeled with the cells used followed by the receptors measured. The top left panel shows a representative cold saturation binding assay performed on COS7 cells expressing the wild type βIL-3 subunit alone. The remaining panels show plots of hot saturation binding assays for the different receptor combinations expressed in either COS or CTLL2 cells as indicated in the figure. In each plot, data from a representative hot or cold saturation binding experiment are shown with the line of best fit determined by co-analysis of data from several binding experiments using LIGAND (39); the derived Kd values are shown in Table 2. Curvilinear plots are indicative of two-site binding models, whereas one-site binding models show a linear fit to the data as shown in the top left panel. B, cell surface expression of wild type and mutant C73AβIL-3 subunits as detected by flow cytometry following the method described under “Experimental Procedures.” Cells stained with only the PE-conjugated antibody were used as a control for each assay (depicted by the gray shaded area).
FIGURE 6.
FIGURE 6.
Proliferation of CTLL2 cell lines stably co-expressing hβc and wild type or C66S hIL-5Rα. Plots depict the percentage of growth in CTLL2 cells stably expressing wild type (wt) or mutant receptors in response to a serial dilution of hIL-5. The data shown are representative of data from at least two experiments performed on two independently transfected stable CTLL2 cell lines (both are shown, denoted A and B).

Similar articles

Cited by

References

    1. Kopf M., Brombacher F., Hodgkin P. D., Ramsay A. J., Milbourne E. A., Dai W. J., Ovington K. S., Behm C. A., Köhler G., Young I. G., Matthaei K. I. (1996) Immunity 4, 15–24 - PubMed
    1. Foster P. S., Hogan S. P., Ramsay A. J., Matthaei K. I., Young I. G. (1996) J. Exp. Med. 183, 195–201 - PMC - PubMed
    1. Lantz C. S., Boesiger J., Song C. H., Mach N., Kobayashi T., Mulligan R. C., Nawa Y., Dranoff G., Galli S. J. (1998) Nature 392, 90–93 - PubMed
    1. Hamilton J. A. (2008) Nat. Rev. Immunol. 8, 533–544 - PubMed
    1. Martinez-Moczygemba M., Doan M. L., Elidemir O., Fan L. L., Cheung S. W., Lei J. T., Moore J. P., Tavana G., Lewis L. R., Zhu Y., Muzny D. M., Gibbs R. A., Huston D. P. (2008) J. Exp. Med. 205, 2711–2716 - PMC - PubMed

Publication types

LinkOut - more resources