. 2010 Aug 6;285(32):24834-44.
doi: 10.1074/jbc.M109.096537. Epub 2010 Jun 1.

Trio is a key guanine nucleotide exchange factor coordinating regulation of the migration and morphogenesis of granule cells in the developing cerebellum

Affiliations

Trio is a key guanine nucleotide exchange factor coordinating regulation of the migration and morphogenesis of granule cells in the developing cerebellum

Ya-Jing Peng et al. J Biol Chem. .

Abstract

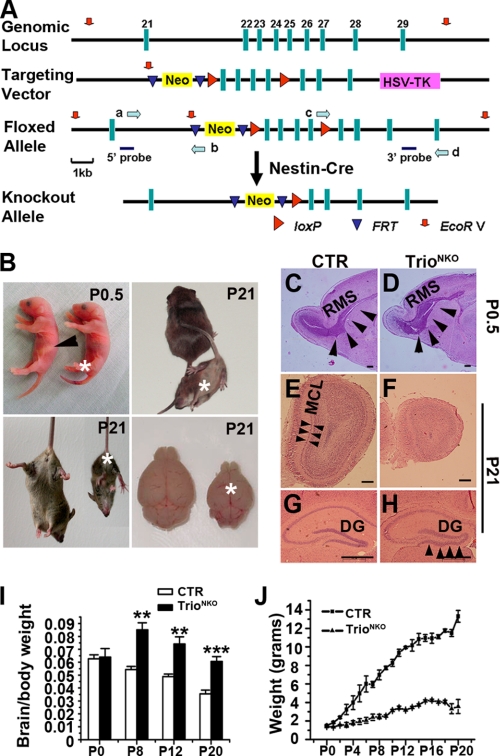
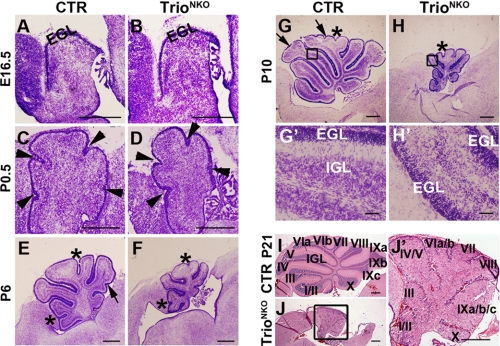
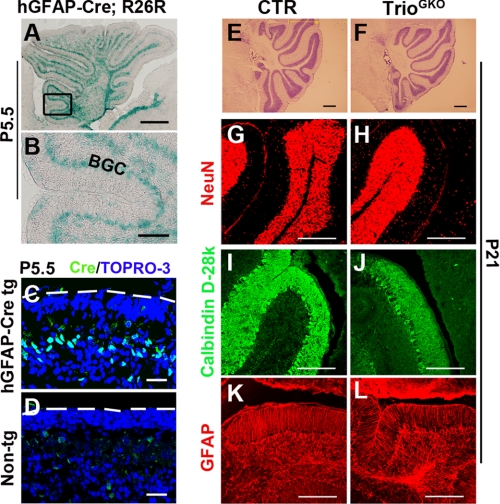
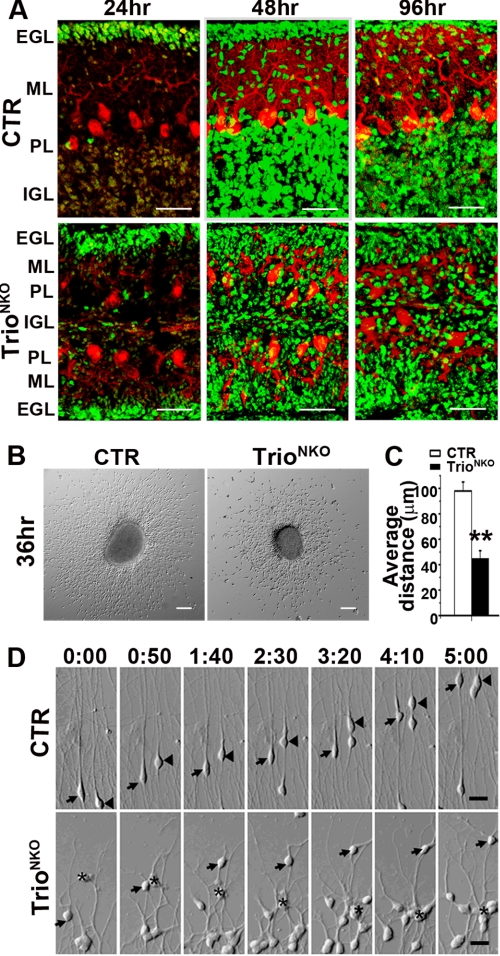
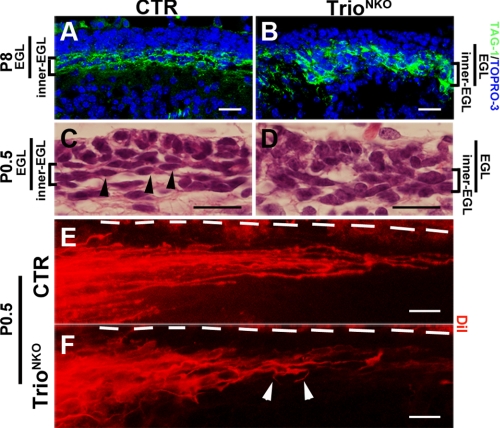
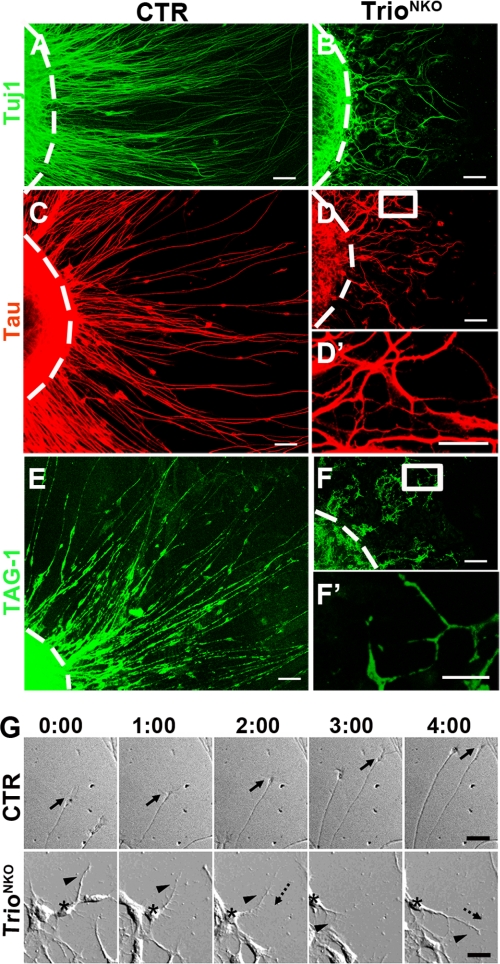
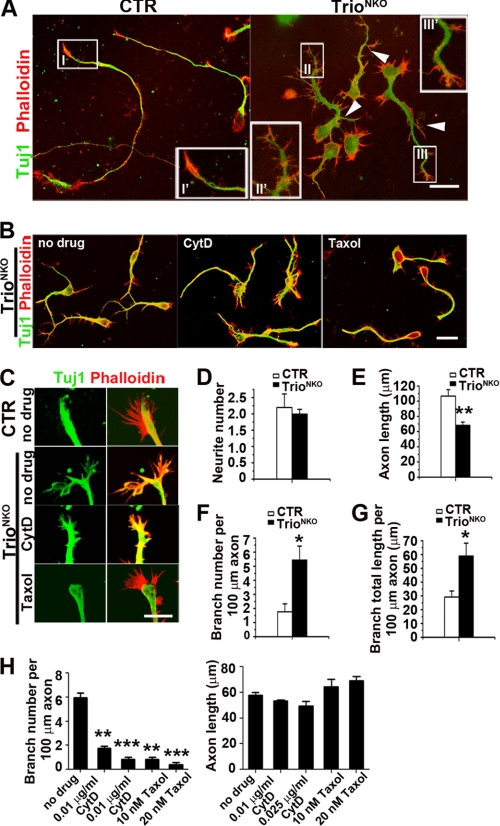
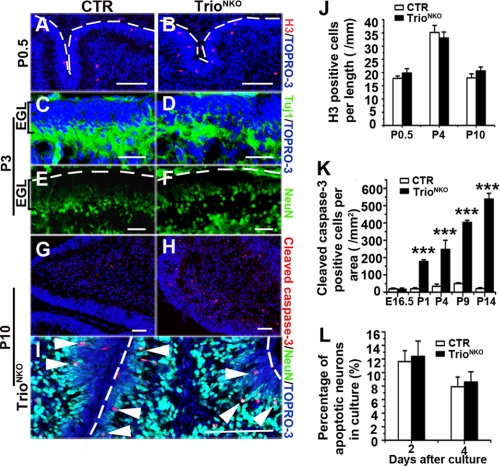
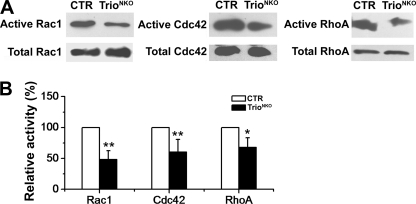
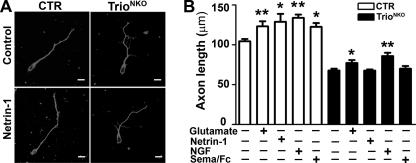
Orchestrated regulation of neuronal migration and morphogenesis is critical for neuronal development and establishment of functional circuits, but its regulatory mechanism is incompletely defined. We established and analyzed mice with neural-specific knock-out of Trio, a guanine nucleotide exchange factor with multiple guanine nucleotide exchange factor domains. Knock-out mice showed defective cerebella and severe signs of ataxia. Mutant cerebella had no granule cells in the internal granule cell layer due to aberrant granule cell migration as well as abnormal neurite growth. Trio-deficient granule cells showed reduced extension of neurites and highly branched and misguided processes with perturbed stabilization of actin and microtubules. Trio deletion caused down-regulation of the activation of Rac1, RhoA, and Cdc42, and mutant granule cells appeared to be unresponsive to neurite growth-promoting molecules such as Netrin-1 and Semaphorin 6A. These results suggest that Trio may be a key signal module for the orchestrated regulation of neuronal migration and morphogenesis during cerebellar development. Trio may serve as a signal integrator decoding extrinsic signals to Rho GTPases for cytoskeleton organization.


Figures

FIGURE 1.
FIGURE 1.
Targeted disruption of the Trio gene in the nervous system. A, schematic representation of Trio knock-out strategy specific to the nervous system. The 11.5-kb genomic DNA fragment containing Trio exons 22–25 was subcloned from 129/sv BAC. The first loxP site (red arrowheads) was targeted downstream of exon 25. Mice containing the floxed allele were crossed with Nestin-Cre (tg) mice to generate Trio+/flox; Nestin-Cre and Trioflox/flox; Nestin-Cre mice. The probes used for Southern blot analysis are shown as solid blue bars, and the locations of PCR primers (a–d) are for screening homologous recombination (green arrows). B, 90% of mutant mice died within 24 h after birth without sucking milk (arrowhead, control stomach filled with milk). Few mutants could survive for 3 weeks with severe ataxia, retarded growth, and smaller brain size. Asterisks indicate the knock-out mice. C and D, Nissl-stained sagittal sections show a reduced size of the mutant olfactory bulb and an enlarged rostral migratory stream (RMS, arrowheads) at P0.5. E and F, hematoxylin and eosin-stained coronal sections of the olfactory bulbs of P21 mice. The mitral cell layer (MCL) is clearly visible in the control mice (arrowheads) but cannot be distinguished from the internal granule cell layer in the mutant mice. G and H, lamination defects of the hippocampus in Trio mutant mice. At P21, granule cells of dentate gyrus (DG) are tightly arranged in the control mice, but not in the mutant (arrowheads). I, the ratio of brain/body weight of Trio-deficient and control mice have no obvious differences at P0, but the ratio of mutant mice increased after P8 compared with the control; **, p < 0.01, ***, p < 0.001. J, the growth curves of CTR and TrioNKO mice. From P2, the weight of mutant mice is significantly lower than control (n = 3–5). Scale bars in C–H, 150 μm.
FIGURE 2.
FIGURE 2.
Nestin-Cre-mediated Trio deletion leads to developmental defects of the cerebellum. A–J′, sagittal sections of cerebella at different developmental stages examined by Nissl staining (A–H′) or hematoxylin and eosin staining (I–J′). A and B, at E16.5, control and mutant cerebella are relatively similar in size and structure. C–J′, from P0.5, mutant cerebella are gradually smaller than control, and a clear IGL is not observed. The overall anteroposterior pattern of foliation is intact in the mutant, although several fissures forming sub-lobules (arrows in E and G) are not developed. Arrowheads represent principal fissures forming cardinal lobes, asterisks indicate fissures forming lobules, and arrows represent fissures forming sub-lobules. Roman numerals represent the corresponding lobules. G′, H′, and J′ are magnifications of G, H, and J, respectively, emphasizing the lack of IGL in the mutant cerebella. Scale bars: A–H and I–J′), 200 μm; G′ and H′, 20 μm.
FIGURE 3.
FIGURE 3.
Normal cerebellar development in Trioflox/flox; GFAP-Cre mice. A and B, Cre activity of the hGFAP-Cre transgene shown by the R26R reporter mouse assay. In hGFAP-Cre; R26R mice, reporter-positive cells were detected at the Bergmann glial cell (BGC) body layer at P5.5. C and D, sagittal sections of the cerebellum from an hGFAP-Cre transgenic mouse and a non-transgene mouse (5.5 days old), immunostained with Cre antibody. Dashed lines indicate the pial surface of the cerebella. E and F, Nissl staining shows the normal structure of the Trioflox/flox; GFAP-Cre cerebella at P21. G and H, post-mitotic granule cells (NeuN), Purkinje cells (Calbindin D-28k), and glial cells (GFAP) are normally located in the mutant as well as the control at P21. Scale bars: A and E–L, 200 μm; B, 40 μm; and C and D, 20 μm.
FIGURE 4.
FIGURE 4.
Defective migration of granule cells in TrioNKO cerebella in vivo and in vitro. A, dividing granule cells of the cerebella were pulse-labeled at P9 by BrdUrd and then visualized by BrdUrd immunofluorescent staining at indicated times after injection. B, microexplants of P4 EGL tissues 36 h after culture. Disordered migration of granule cells occurred in the mutant explant. C, decrease in mean migration distance of granule cells from the edge of aggregates in the Trio mutant; **, p < 0.01. D, microexplants were prepared from P4 EGL and cultured for 30 h before imaging. Explants are at the bottom of the frame. Intervals between pictures were 50 min. Control granule cells migrated in the opposite direction to the explant (arrows and arrowheads), whereas most Trio-deficient granule cells moved randomly (arrows) or backwards to the explant (asterisk). Scale bars: A, 25 μm; B, 100 μm; and D, 50 μm.
FIGURE 5.
FIGURE 5.
Disrupted formation of parallel fibers in Trioflox/flox; Nestin-Cre mice. A and B, early parallel fibers in the inner EGL labeled with TAG-1 are thick and non-compact in Trio-deficient mice compared with control littermates. C and D, hematoxylin and eosin stained of coronal sections of P0.5 cerebella. Spindle-shaped cells (arrowheads) are horizontally located in the inner EGL of control mice. Mutant cell bodies in the inner EGL are disordered. E and F, DiI-labeled parallel fibers. Horizontal beams of parallel fibers in the inner EGL of CTR cerebellum (E) are not formed in the Trio mutant (F). Disorganized fibers are indicated by white arrowheads. Dashed lines indicate the pial surface of the cerebella. Scale bars in A–F: 20 μm.
FIGURE 6.
FIGURE 6.
Trio-deleted cerebellar EGL microexplant in culture displayed impaired formation of neurites. Expression of Tuj1 (A and B), Tau (C, D, and D′), and TAG-1 (E, F, and F′) in P4 EGL microexplants 36 h after culture. The dashed lines indicate the original border of the explants. D′ and F′ are magnifications of D and F, respectively. TrioNKO microexplant had short, disoriented, and fewer axons (B, D, and D′) and virtually no long parallel fiber formation (TAG-1 staining) (F and F′). G, microexplants were prepared from P4 EGL and cultured for 30 h before imaging. Explants are at the bottom of the frame. Intervals between pictures were 60 min. The control neuron extended long radial axons under the guidance of growth cones (arrows). The mutant neuron (asterisk) extended short axons with many branches (arrowhead). Frequently, the extended axon may retract (long dashed arrow) and then re-extend again (short dashed arrow). Scale bars: A–D, E, and F, 40 μm; D′ and F′, 10 μm; and G, 50 μm.
FIGURE 7.
FIGURE 7.
Abnormal neurite morphogenesis of TrioNKO cerebellar granule cells in culture. A, representative granule cells 2.5 days after plating. Neurons were double-labeled with antibody against Tuj1 and TRITC-labeled phalloidin. White arrowheads indicate mutant axon branches. I′, II′, and III′ are magnifications of I, II, and III, respectively, emphasizing irregular growth cone formation in the mutant. B, 24 h after culture, cerebellar granule cells were treated with cytochalasin D and taxol for 36 h. C, 24 h after culture, cerebellar granule cells were treated with cytochalasin D and taxol for 4 h. D–G, statistical analysis for the number and length of neurites; n = 20 neurons from three independent cultures. D, control and mutant granule cells had an equivalent number of neurites arising from the cell body. E, axon length was shorter in the mutant than in the control; *, p < 0.05; **, p < 0.01. F and G, branching density (branches per unit) for axon and total branch length per unit length of axon were increased in Trio-deficient granule cells compared with control. H, branch density and axon length of mutant granule cells treated with cytochalasin D and taxol; **, p < 0.05; ***, p < 0.001. Scale bars: A and B, 20 μm; C, 10 μm.
FIGURE 8.
FIGURE 8.
Normal proliferation and differentiation determination but increased apoptosis of Trioflox/flox; Nestin-Cre granule cells. A and B, phospho-histone-H3 (H3) immunostaining shows normal proliferation ability of mutant EGL. Dashed lines indicate the pial surface. C and D, the expression pattern for process extension can be detected by Tuj1 in the mutant inner EGL at P3. E and F, the differentiated neuron maker NeuN exists in the inner EGL in the mutant mice as the control at P3. Dashed lines indicate the pial surface. G and H, apoptosis, characterized by cleaved caspase-3, is greatly aggravated in mutant cerebella. I, most of the apoptotic cells in the mutant are NeuN-positive (white arrowheads) in the inner EGL or molecular layer. Dashed lines indicate the pial surface. J, H3-positive cells at the outer EGL per unit length of EGL. K, quantification of apoptotic cerebellar cells per area of cerebella during different developmental stages (n = 3); ***, p < 0.001. L, quantification of apoptotic granule cells in vitro by propidium iodide staining. Cerebellar neurons were from P4 mice and cultured at high density (600 neurons per mm2). The histogram indicates that the percentage of apoptotic cells in Trio mutant neurons was comparable to CTR cultured for 2 and 4 days. Scale bars in A–I, 100 μm.
FIGURE 9.
FIGURE 9.
Quantification of active Rho small GTPases. A, GTP-bound Rac1, Cdc42, and RhoA were pulled down using PBD-GST (Rac1 and Cdc42) and RBD-GST (RhoA) from lysates of CTR and mutant total brain at P0.5. Active Rac1, Cdc42, and RhoA pulldown assays were detected by Western blot using antibodies against Rac1, Cdc42, and RhoA, respectively. Total Rac1, Cdc42, and RhoA in cell lysates indicated equal amounts of the GTPases (bottom). B, the histogram shows that the rate of active Rac1, RhoA, and Cdc42 was significantly reduced in mutant mice (p = 0.001 for Rac1, n = 5; p = 0.009 for RhoA, n = 5; p = 0.03 for Cdc42, n = 4); *, p < 0.05; **, p < 0.01.
FIGURE 10.
FIGURE 10.
Neurite outgrowth in response to exogenous cues. A, neurite outgrowth of control and TrioNKO cerebellar neurons cultured for 2.5 days in vitro with control buffer and the buffer with Netrin-1. B, quantification of mean axon length of cerebellar granule cells 2.5 days after plating with control buffer, glutamate, Netrin-1, nerve growth factor, and Semaphorin 6A/Fc; *, p < 0.05; **, p < 0.01. Scale bar in A, 20 μm.

Similar articles

Cited by

References

    1. Hatten M. E. (1999) Annu. Rev. Neurosci. 22, 511–539 - PubMed
    1. Wingate R. J. (2001) Curr. Opin. Neurobiol. 11, 82–88 - PubMed
    1. Wang V. Y., Zoghbi H. Y. (2001) Nat. Rev. Neurosci. 2, 484–491 - PubMed
    1. Ayala R., Shu T., Tsai L. H. (2007) Cell 128, 29–43 - PubMed
    1. Komuro H., Yacubova E. (2003) Cell Mol. Life Sci. 60, 1084–1098 - PMC - PubMed

Publication types

MeSH terms