. 2010 Jul 30;285(31):24248-59.
doi: 10.1074/jbc.M109.094581. Epub 2010 Jun 1.

Differential roles of Epac in regulating cell death in neuronal and myocardial cells

Affiliations

Differential roles of Epac in regulating cell death in neuronal and myocardial cells

Sayaka Suzuki et al. J Biol Chem. .

Abstract

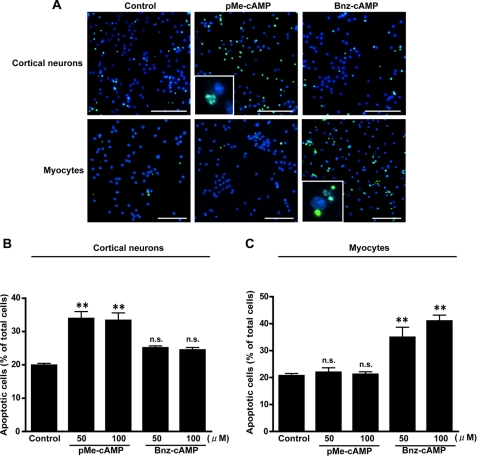
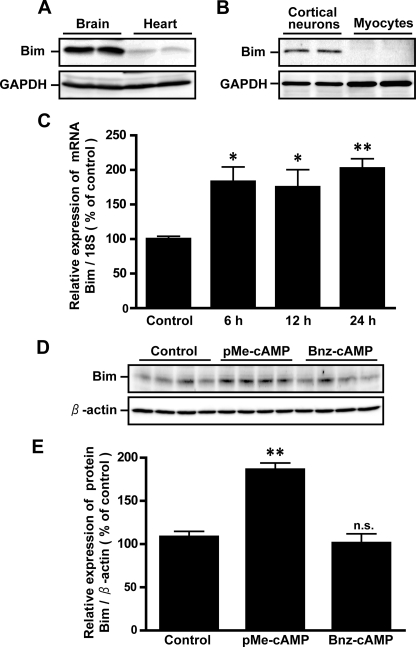
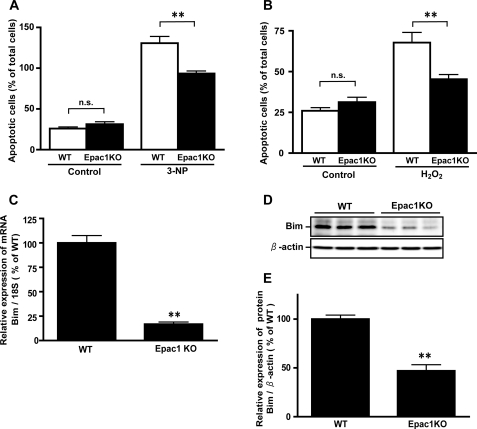
Cell survival and death play critical roles in tissues composed of post-mitotic cells. Cyclic AMP (cAMP) has been known to exert a distinct effect on cell susceptibility to apoptosis, protecting neuronal cells and deteriorating myocardial cells. These effects are primarily studied using protein kinase A activation. In this study we show the differential roles of Epac, an exchange protein activated by cAMP and a new effector molecule of cAMP signaling, in regulating apoptosis in these cell types. Both stimulation of Epac by 8-p-methoxyphenylthon-2'-O-methyl-cAMP and overexpression of Epac significantly increased DNA fragmentation and TUNEL (terminal deoxynucleotidyltransferase-mediated biotin nick end-labeling)-positive cell counts in mouse cortical neurons but not in cardiac myocytes. In contrast, stimulation of protein kinase A increased apoptosis in cardiac myocytes but not in neuronal cells. In cortical neurons the expression of the Bcl-2 interacting member protein (Bim) was increased by stimulation of Epac at the transcriptional level and was decreased in mice with genetic disruption of Epac1. Epac-induced neuronal apoptosis was attenuated by the silencing of Bim. Furthermore, Epac1 disruption in vivo abolished the 3-nitropropionic acid-induced neuronal apoptosis that occurs in wild-type mice. These results suggest that Epac induces neuron-specific apoptosis through increasing Bim expression. Because the disruption of Epac exerted a protective effect on neuronal apoptosis in vivo, the inhibition of Epac may be a consideration in designing a therapeutic strategy for the treatment of neurodegenerative diseases.


Figures

FIGURE 1.
FIGURE 1.
Effects of activation of Epac and PKA on apoptosis in cortical neurons and cardiac myocytes. A, apoptotic cells (green) in cortical neurons and myocytes were examined by means of TUNEL staining 48 h after treatment with pMe-cAMP (50 μm) or Bnz-cAMP (50 μm). Nuclei were stained with DAPI (blue). Scale bar, 100 μm. The inset is magnified five additional times. B and C, quantification of TUNEL-positive cells by counting nuclei in cortical neurons and cardiac myocytes is shown. The results are presented as percentages of the total cell number. n = 6 from 3 independent experiments. **, p < 0.01 versus control. n.s., not significant.
FIGURE 2.
FIGURE 2.
Effects of overexpression of Epac and PKA on apoptosis in cortical neurons and cardiac myocytes. A, shown are the representative immunoblots of cortical neurons or myocytes transfected with Epac1, Epac2, PKA α catalytic subunit, PKA regulatory subunit, and LacZ for 12 h (multiplicity of infection = 2). β-Actin served as an internal control. C–F, apoptosis was evaluated by means of TUNEL staining (C and D) and cell death detection enzyme-linked immunosorbent assay (E and F) 48 h after incubation with indicated adenovirus and an Epac-selective cAMP analog in cortical neurons and cardiac myocytes. The results are presented as percentages of the total cell number. n = 4–8 from 2 independent experiments. **, p < 0.01, versus LacZ control. n.s., not significant.
FIGURE 3.
FIGURE 3.
Activation of Epac increased the expression of Bim mRNA and protein in cortical neurons. A and B, shown is expression of endogenous Bim protein in brain and heart tissues (A) and cultured cortical cells and cardiac myocytes (B). C, the expression of Bim mRNA in cortical neurons was quantified using real-time RT-PCR. The data are normalized to 18 S ribosomal RNA. D, shown are representative immunoblots of Bim 24 h after the addition of pMe-cAMP (50 μm) or Bnz-cAMP (50 μm) in cortical neurons. β-Actin served as an internal control. E, shown is quantification of cAMP analog-induced Bim expression from three independent experiments. The results are presented as percentages of the amount of Bim expressed in the control experiment. n = 6–8, **, p < 0.01 versus control. GAPDH, glyceraldehyde-3-phosphate dehydrogenase.
FIGURE 4.
FIGURE 4.
Effect of p38 MAPK on Epac-induced Bim expression and apoptosis in cortical neurons. A and B, shown are representative images and quantification of phosphorylation/total p38 protein in mouse cortical neurons treated with pMe-cAMP (50 μm) or Bnz-cAMP (50 μm) for 24 h. The results are presented as percentages of the amount of phosphorylation observed in the control experiment. n = 6 from 3 independent experiments. **, p < 0.01 versus control. C, the expression of Bim mRNA 24 h after the addition of pMe-cAMP (50 μm) or SB203580 (10 μm) plus pMe-cAMP (50 μm) in cortical neurons was quantified using real-time RT-PCR. The data are normalized to 18 S ribosomal RNA. n = 6–8; **, p < 0.01 versus control. D, apoptotic cells in cortical neurons and myocytes were examined by means of TUNEL staining 48 h after treatment with pMe-cAMP (50 μm) or SB203580 (10 μm) plus pMe-cAMP (50 μm). TUNEL-positive cells were quantified by counting nuclei in cortical neurons. The results are presented as percentages of the total cell number. n = 4–6; **, p < 0.01 versus control. n.s., not significant.
FIGURE 5.
FIGURE 5.
Activation of Epac promoted interaction between Bcl-2 and Bim protein and decreased mitochondrial transmembrane potential in cortical neurons. A–C, a representative immunoblot (IB) shows the interaction between Bcl-2 and Bim protein was increased by treatment with pMe-cAMP (50 μm) in a time-dependent manner. IP, immunoprecipitate. D–G, the pixel intensity of the bands obtained in each experiment was calculated. The results are presented as percentages of the intensity of the corresponding bands in the control experiment. n = 5 from 5 independent experiments. n.s., not significant. **, p < 0.05 versus control. H and I, interaction of Bim and Bcl-2 in cortical neurons 24 h after incubation with pMe-cAMP (50 μm) or Bnz-cAMP (50 μm) was observed by means of immunoprecipitation with an antibody to Bim or Bcl-2. J, the changes in mitochondrial transmembrane potential were detected using the MitoCapture Apoptosis detection kit 48 h after the addition of pMe-cAMP (50 μm) or Bnz-cAMP (50 μm) in cortical neurons. Representative photomicrographs of cortical neurons stained with a cationic dye that fluoresces red in intact cells and green in apoptotic cells are shown. All nuclei were stained with DAPI (blue). Scale bar, 50 μm. K, apoptotic cells were counted, and their incidence was calculated. The results are presented as percentages of the total cell number. n = 4; **, p < 0.01 versus control.
FIGURE 6.
FIGURE 6.
Silencing of Bim attenuated Epac-induced apoptosis in cortical neurons. A, shown is a representative immunoblot of Bim 72 h after transfection of Bim-targeted siRNA or negative siRNA control in cortical neurons. B, cortical neurons were transfected with indicated siRNA for 72 h, then treated with pMe-cAMP (50 μm) for 48 h. Apoptotic cells (green) were analyzed for TUNEL staining. All nuclei were stained with DAPI (blue). Scale bar, 100 μm. C, TUNEL-positive cells were quantified by counting nuclei in cortical neurons. The results are presented as percentages of the total cell number. n = 4; **, p < 0.01; *, p < 0.05 versus scramble siRNA. n.s., not significant.
FIGURE 7.
FIGURE 7.
Generation of Epac1 gene-targeted mice. A, targeted disruption of the Epac1 gene is shown. The partial structure of the Epac1 gene (WT) and the resultant mutated allele (Epac1 KO) are shown. The positions of the phosphoglycerate kinase promoter neo cassette (Neo) and 5′-probe are indicated. B, shown is a Southern blot analysis of targeted embryonic stem cell (ES) clones. Genomic DNA from control TT2 ES cells and homologous targeted clones was digested with AseI and Not1 and hybridized with the probe as indicated in A. C, genotyping mice by PCR is shown. D, Northern blot analysis of Epac1, Epac2, and glyceraldehyde-3-phosphate dehydrogenase (GAPDH) in the brains of WT and Epac1 KO mice is shown. E, Rap1 activation of renal epithelial cells from WT and Epac1 KO mice 15 min after treatment with pMe-cAMP (50 μm) is shown. The data are normalized to total Rap1. n = 4; **, p < 0.01 versus WT mice.
FIGURE 8.
FIGURE 8.
The effect of 3-NP and hydroperoxide on apoptosis in cortical neurons from WT and Epac1 KO mice. A and B, apoptosis was evaluated by means of TUNEL staining 48 h after the addition of the indicated reagents in cortical neurons from WT and Epac1 KO mice. The results are presented as percentages of the total cell number. C, the expression of endogenous Bim mRNA in cortical neurons from WT and Epac 1KO mice was quantified using real-time RT-PCR. The data are normalized to 18 S ribosomal RNA. n = 6–8; **, p < 0.01 versus WT. D, shown is a representative immunoblot of endogenous Bim protein expression in cortical neurons from WT and Epac1 KO mice. β-actin served as an internal control. E, the pixel intensity of the representative bands obtained in each experiment was calculated as described. n = 4; **, p < 0.01 versus WT mice. n.s., not significant.
FIGURE 9.
FIGURE 9.
Deletion of Epac1 suppressed 3-NP-induced brain cell apoptosis in vivo. A and D, representative images of TUNEL staining and immunohistochemistry of cleaved caspase 3 of cortical and striatal sections from WT or Epac1 KO mice 24 h after injection of 3-NP. Scale bar, 100 μm. B and E, TUNEL-positive cells were quantified by counting nuclei in five randomly chosen fields. C and F, cleaved caspase 3-positive cells were quantified by counting nuclei in 5 randomly chosen fields. Deletion of Epac abrogated 3-NP-induced apoptosis in both the cortex and the striatum in vivo. The results are presented as percentages of the total cell number. n = 5 from 2 independent experiments. *, p < 0.05. n.s., not significant.

Similar articles

Cited by

References

    1. Mattson M. P., Kroemer G. (2003) Trends Mol. Med. 9, 196–205 - PubMed
    1. D'Mello S. R., Galli C., Ciotti T., Calissano P. (1993) Proc. Natl. Acad. Sci. U.S.A. 90, 10989–10993 - PMC - PubMed
    1. Kobayashi Y., Shinozawa T. (1997) Brain Res. 778, 309–317 - PubMed
    1. Parvathenani L. K., Calandra V., Roberts S. B., Posmantur R. (2000) Neuroreport 11, 2293–2297 - PubMed
    1. Jonakait G. M., Ni L. (2009) Brain Res. 1285, 30–41 - PubMed

Publication types

Substances

LinkOut - more resources