. 2010 Jul 1;70(13):5358-67.
doi: 10.1158/0008-5472.CAN-10-0027. Epub 2010 Jun 1.

Taspase1 functions as a non-oncogene addiction protease that coordinates cancer cell proliferation and apoptosis

Affiliations

Taspase1 functions as a non-oncogene addiction protease that coordinates cancer cell proliferation and apoptosis

David Y Chen et al. Cancer Res. .

Abstract

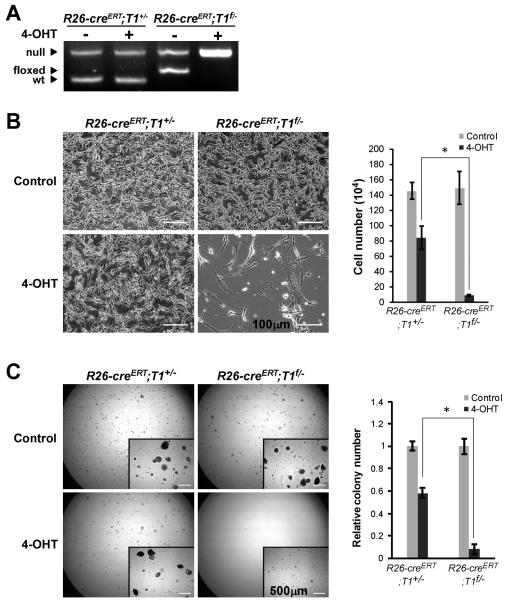
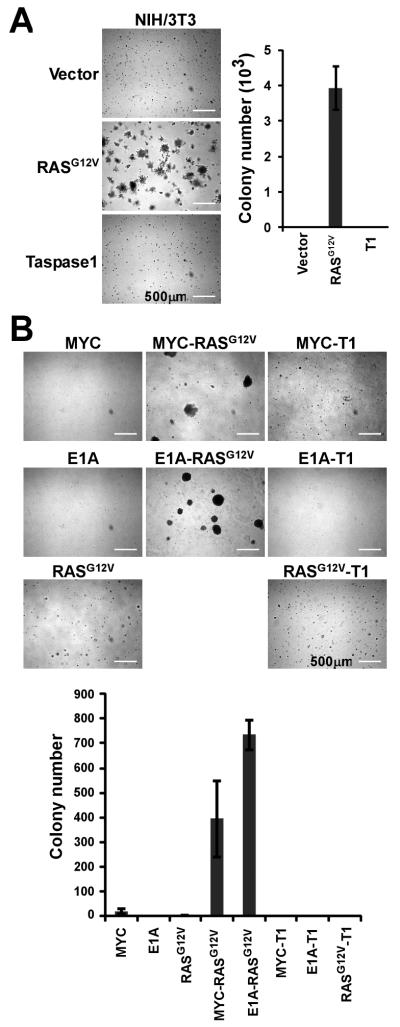
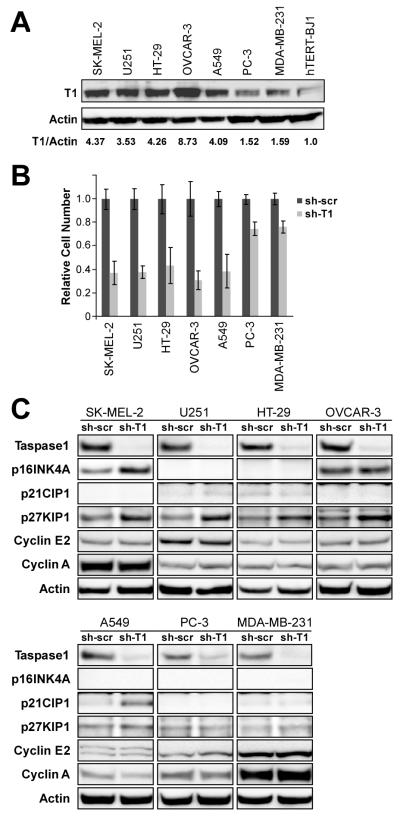
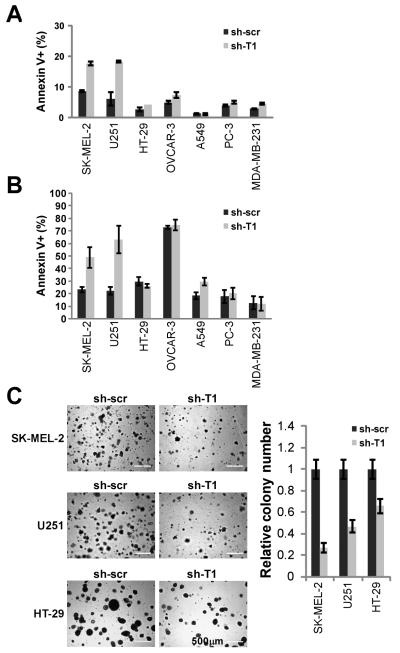
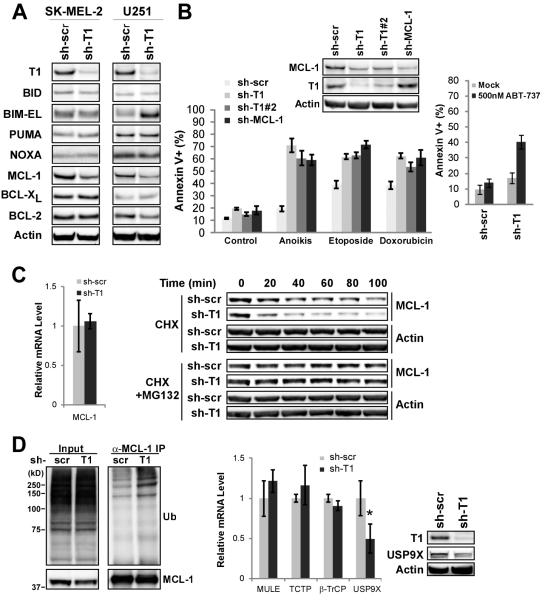
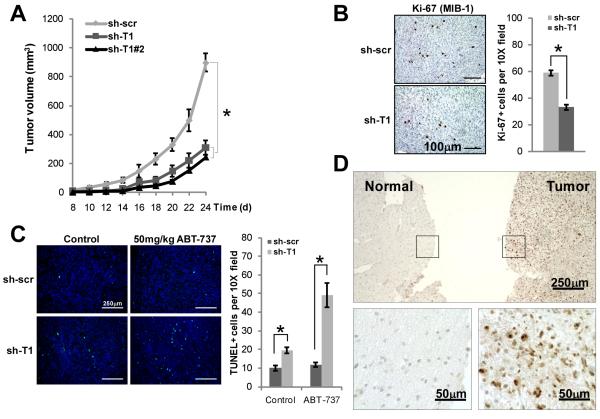
Taspase1, the mixed lineage leukemia and TFIIAalpha-beta cleaving protease, enables cell proliferation and permits oncogenic initiation. Here, we show its critical role in cancer maintenance and thus offer a new anticancer target. Taspase1 is overexpressed in primary human cancers, and deficiency of Taspase1 in cancer cells not only disrupts proliferation but also enhances apoptosis. Mechanistically, loss of Taspase1 induces the levels of CDK inhibitors (CDKI: p16, p21, and p27) and reduces the level of antiapoptotic MCL-1. Therapeutically, deficiency of Taspase1 synergizes with chemotherapeutic agents and ABT-737, an inhibitor of BCL-2/BCL-X(L), to kill cancer cells. Taspase1 alone or in conjunction with MYC, RAS, or E1A fails to transform NIH/3T3 cells or primary mouse embryonic fibroblasts, respectively, but plays critical roles in cancer initiation and maintenance. Therefore, Taspase1 is better classified as a "non-oncogene addiction" protease, the inhibition of which may offer a novel anticancer therapeutic strategy. The reliance of oncogenes on subordinate non-oncogenes during tumorigenesis underscores the non-oncogene addiction hypothesis in which a large class of non-oncogenes functions to maintain cancer phenotypes and presents attractive anticancer therapeutic targets. The emergence of successful cancer therapeutics targeting non-oncogenes to which cancers are addicted supports the future development and potential application of small-molecule Taspase1 inhibitors for cancer therapy.


Figures

Figure 1
Figure 1
Taspase1 is Required for the Maintenance of MYC-RAS Transformed Mouse Embryonic Fibroblasts (MEFs). A, MYC-RAS transduced MEFs of the indicated genotypes were treated with 500 nM 4-hydroxytamoxifen (4-OHT) for 6 hours to activate R26-creERT. Deletion of the conditional (floxed; f) Taspase1 allele was confirmed by PCR at day 3. B, 105 MYC-RAS transduced MEFs of the indicated genotypes were mock (DMSO) or 4-OHT treated for 6 hours before plating on 6 cm dishes. Cells were photographed and counted at day 5. Scale bar equals 100 μm. Data presented are mean ± SD of duplicates of three independent experiments. C, 5×10⁴ MYC-RAS transduced MEFs of the indicated genotypes were treated as B and plated on soft agar. Positive clones (>200 μm) were scored 1.5-2 weeks after the initial plating. Insets are higher-magnification images. Scale bar equals 500 μm. Data presented are mean ± SD of duplicates of two independent experiments. The average of colony numbers in mock treated plates was assigned as 1. Asterisk indicates P < 0.0005, determined by Fisher’s exact test.
Figure 2
Figure 2
Taspase1 is not a Classical Oncogene. A, NIH/3T3 cells were transduced with the indicated genes and plated on soft agar. 5×10⁴ cells were plated in each 6 cm dish. Positive clones (>200 μm) were scored 10 days after the initial plating. Data presented are mean ± SD of duplicates of two independent experiments. B, Wild-type primary MEFs were transduced with the indicated pairs of genes and plated on soft agar. 5×10⁴ cells were plated in each 6 cm dish. Positive clones (>200 μm) were scored 2-3 weeks after the initial plating. Data presented are mean ± SD of triplicates of two independent experiments. Inserts are higher-magnification images. Scale bar equals 500 μm. T1 denotes Taspase1.
Figure 3
Figure 3
Taspase1 is Required for the Proliferation of Human Cancer Cells. A, The protein levels of Taspase1 and β-actin of the indicated human cancer cell lines were assessed by anti-Taspase1 α28 and anti-β-actin antibodies. The relative expression of Taspase1 versus β-actin in hTERT-BJ-1 cells was assigned as 1. B, Human cancer cell lines with control- or Taspase1-knockdown were plated on 6-well plates and cell numbers were counted four days after the initial plating. The average cell number of control-knockdown cells was assigned as 1. Data presented are mean ± SD of duplicates of three independent experiments. C, The stable knockdown of Taspase1 in the indicated human cancer cell lines was determined by anti-Taspase1 α28 immunoblots. The expression of p16, p21, p27, Cyclin E2, and Cyclin A was determined by respective antibodies. The anti-β-actin immunoblots indicate equal protein loading.
Figure 4
Figure 4
Deficiency of Taspase1 Results in Increased Anoikis and Decreased Anchorage-independent Growth of SK-MEL-2 Melanoma and U251 Glioblastoma Cells. A, Human cancer cell lines with control- or Taspase1-knockdown were stained with annexin V and analyzed by FACS. B, Human cancer cell lines with control- or Taspase1-knockdown were cultured in PolyHEMA pre-treated 6-well plates for 3 days, stained with annexin V, and analyzed by FACS. C, SK-MEL-2, U251, or HT-29 cells with control- or Taspase1-knockdown were plated on soft agar. Positive clones (>100 μm) were scored 2-3 weeks after the initial plating of 105 cells. Scale bar equals 500 μm. Annexin V stains positive for apoptotic cells. Data presented in A, B, and C are mean ± SD duplicates of three independent experiments.
Figure 5
Figure 5
Taspase1 Deficiency Leads to Decreased MCL-1 Protein and Increased Cancer Cell Death upon Treatment with Chemotherapeutic Agents and ABT-737. A, Cellular extracts of SK-MEL-2 or U251 cells with control- or Taspase1-knockdown were subjected to Western blot analyses using the indicated antibodies. B, U251 cells with the indicated knockdown were treated with various apoptotic stimuli, stained with annexin-V, and analyzed by FACS. For anoikis assays, cells were plated in PolyHEMA coated plates for 3 days. For chemotherapeutic agent-induced cell death, cells were treated with 100 μg/mL of etoposide or 10 μM of doxorubicin for 30 hours. Data presented are mean ± SD of duplicates of two independent experiments. U251 cells with indicated knockdown were mock (DMSO) or ABT-737 treated for 24 hours, stained with annexin-V, and analyzed by FACS. Data presented are mean ± SD of triplicates of two independent experiments. C, The transcript levels of MCL-1 in control- or Taspase1-knockdown U251 cells were determined by quantitative RT-PCR analysis (left). U251 cells with indicated knockdown were subjected to cyclohexamide or cyclohexamide plus MG132 treatment for the indicated periods of time, and the protein levels of MCL-1 and β-actin were determined by immunoblot (right). D, The ubiquitination status of MCL-1 in U251 cells with control- or Taspase1-knockdown were treated with MG132, and subjected to anti-MCL-1 immunoprecipitation followed by anti-ubiquitin immunoblots. Transcript levels of known MCL-1 stability regulators were analyzed and the protein expression of USP9X was determined. Asterisk indicates P < 0.01. Data presented in C and D are mean ± SD of duplicates of three independent experiments and the transcript level in control-knockdown cells was assigned as 1.
Figure 6
Figure 6
Taspase1 Loss Disrupts Growth of Tumor Xenografts and Taspase1 is Over-expressed in Primary Human Cancers. A, U251 cells with control- or Taspase1-knockdown were injected into the flanks of NOD;scid;IL2Rγ−/− mice and tumor growth was measured. B, Proliferative index of U251 xenografts was determined by anti-Ki-67 immunohistochemistry. Sections shown at 20X magnification. Bar graph represents mean ± SEM of Ki-67+ cells per 10X fields (10 fields per tumor, n=2 tumors each). C, Baseline and ABT-737-induced tumor cell death were determined by TUNEL staining 12 hours after a single vehicle control or ABT-737 intraperitoneal injection. Tumors Sections shown are 10X fields of FITC-TdT (green) or DAPI (blue). Bar graph represents mean ± SEM of TUNEL+ cells per 10X fields (10 fields per tumor, n=2 tumors each). D, Immunohistochemistry of primary human GBM and adjacent normal brain was examined with an anti-Taspase1 monoclonal antibody (10H2F6). High magnification pictures of boxed areas are provided. Asterisks indicate P < 0.005.

References

    1. Vogelstein B, Kinzler KW. Cancer genes and the pathways they control. Nature medicine. 2004;10:789–99. - PubMed
    1. Hanahan D, Weinberg RA. The hallmarks of cancer. Cell. 2000;100:57–70. - PubMed
    1. Weinstein IB, Joe A. Oncogene addiction. Cancer Res. 2008;68:3077–80. discussion 80. - PubMed
    1. Zhang J, Yang PL, Gray NS. Targeting cancer with small molecule kinase inhibitors. Nat Rev Cancer. 2009;9:28–39. - PubMed
    1. Luo J, Solimini NL, Elledge SJ. Principles of cancer therapy: oncogene and non-oncogene addiction. Cell. 2009;136:823–37. - PMC - PubMed

Publication types

MeSH terms