. 2010 Jun 1;24(11):1093-105.
doi: 10.1101/gad.1897910.

Modeling T-cell acute lymphoblastic leukemia induced by the SCL and LMO1 oncogenes

Affiliations

Modeling T-cell acute lymphoblastic leukemia induced by the SCL and LMO1 oncogenes

Mathieu Tremblay et al. Genes Dev. .

Abstract

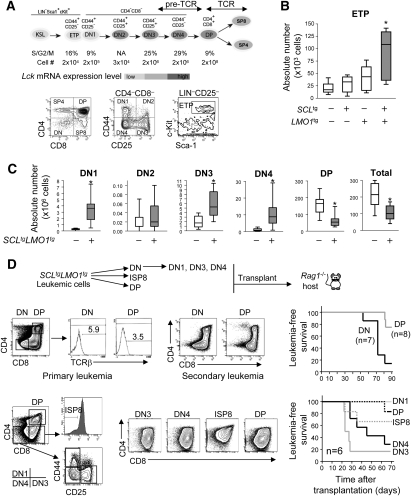
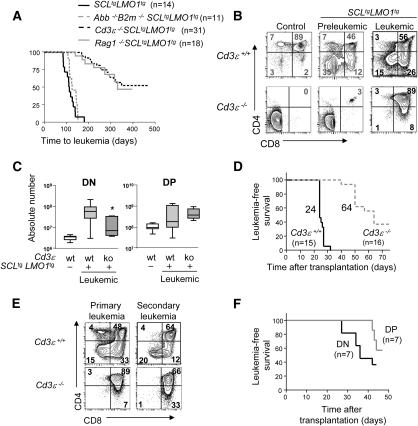
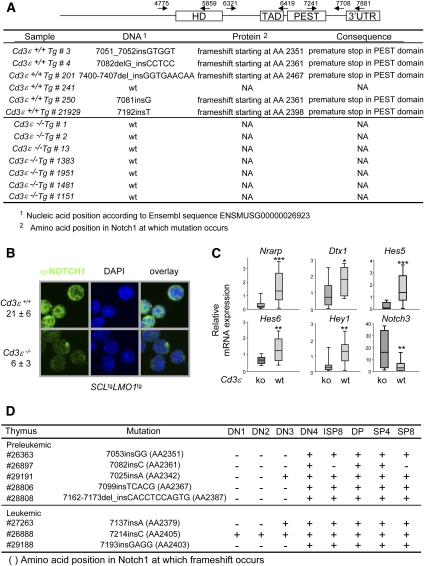
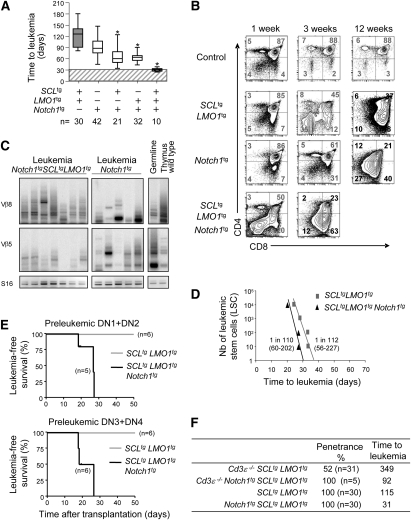
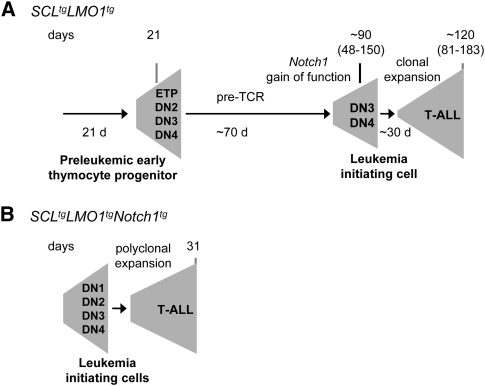
Deciphering molecular events required for full transformation of normal cells into cancer cells remains a challenge. In T-cell acute lymphoblastic leukemia (T-ALL), the genes encoding the TAL1/SCL and LMO1/2 transcription factors are recurring targets of chromosomal translocations, whereas NOTCH1 is activated in >50% of samples. Here we show that the SCL and LMO1 oncogenes collaborate to expand primitive thymocyte progenitors and inhibit later stages of differentiation. Together with pre-T-cell antigen receptor (pre-TCR) signaling, these oncogenes provide a favorable context for the acquisition of activating Notch1 mutations and the emergence of self-renewing leukemia-initiating cells in T-ALL. All tumor cells harness identical and specific Notch1 mutations and Tcrbeta clonal signature, indicative of clonal dominance and concurring with the observation that Notch1 gain of function confers a selective advantage to SCL-LMO1 transgenic thymocytes. Accordingly, a hyperactive Notch1 allele accelerates leukemia onset induced by SCL-LMO1 and bypasses the requirement for pre-TCR signaling. Finally, the time to leukemia induced by the three transgenes corresponds to the time required for clonal expansion from a single leukemic stem cell, suggesting that SCL, LMO1, and Notch1 gain of function, together with an active pre-TCR, might represent the minimum set of complementing events for the transformation of susceptible thymocytes.


Figures

Figure 1.
Figure 1.
The SCL and LMO1 oncogenes expand the population of ETPs and induce CD3-dependent but antigen-independent T-ALL. (A) Schematic diagram of thymocyte populations and their cell surface markers. ETPs are Kit+Sca1+LinCD25. Thymocyte populations (DN1–DN4, DP, SP4, and SP8) are Thy1.2+ and can be further differentiated on the basis of CD25, CD44, CD4, and CD8 expression. The pre-TCR is essential for DN-to-DP transition, whereas the TCR regulates negative and positive selection. Shown are the absolute numbers, the percentages of cells in S/G2/M phase, and Lck expression levels as assessed by real-time PCR for each subset of wild-type thymocyte. (B) The absolute number of ETPs was assessed by flow cytometry analysis of wild-type, SCLtg, LMO1tg, and SCLtgLMO1tg mice at the preleukemic stage (3 wk old). Shown are box plots delimited by the lower and upper 25 percentiles of the distribution with results from Student's t-test ([*] P < 0.001 compared with wild type). The line inside the box plots represents the median, and those outside represent the two extreme values. (C) The absolute number of DN1-to-DP populations was assessed by flow cytometry analysis in wild-type and preleukemic SCLtgLMO1tg mice as in B. (D) Diagram of the transplantation strategy. Indicated leukemic populations were purified from Rag1+/+SCLtgLMO1tg thymomas and transplanted into immunodeficient Rag1−/− mice at concentrations of 103 (DN and DP) or 104 (DN1, DN3, DN4, ISP8 and DP) cells. Examples of tumor phenotypes from primary and secondary leukemias, as well as Kaplan-Meier curves of the time to leukemia, are shown.
Figure 2.
Figure 2.
Leukemia initiation is reduced in the absence of CD3/pre-TCR signaling. (A) Kaplan-Meier curves of the time to leukemia for SCLtgLMO1tg, Cd3ɛ−/− SCLtgLMO1tg, Rag1−/−SCLtgLMO1tg, and Abb−/−B2m−/−SCLtgLMO1tg mice. All malignant thymic lymphomas were diagnosed at necropsy. The median survival times for each cohort of n mice are shown. (B) Preleukemic and leukemic phenotypes of SCLtgLMO1tg thymocytes. Representative flow cytometry analysis of thymocytes from wild-type and Cd3ɛ−/−SCLtgLMO1tg as well as nontransgenic control littermates was performed during the preleukemic stage (4 wk old) and at the time of overt leukemia. Numbers in gray are for preleukemic cells and numbers in black are for overt leukemia phenotype. (C) The absolute number of DN and DP populations was assessed by flow cytometry analysis for Cd3ɛ+/+SCLtgLMO1tg and Cd3ɛ−/−SCLtgLMO1tg tumors. Box plots shown as in Figure 1B ([*] P < 0.05 as compared with Cd3ɛ+/+SCLtgLMO1tg mice). (D) Time to leukemia after transplantation of 106 leukemic Cd3ɛ+/+ SCLtgLMO1tg or Cd3ɛ−/− SCLtgLMO1tg cells in Rag1−/− mice (n mice per group). Shown are the median survival times for each cohort. (E) Representative leukemic phenotypes of primary and secondary Cd3ɛ+/+ and Cd3ɛ−/− SCLtgLMO1tg tumors as in B. (F) Kaplan-Meier curves of the time to leukemia for purified DN or DP leukemic populations from Cd3ɛ−/−SCLtgLMO1tg thymomas transplanted into immunodeficient Rag1−/− mice at a concentration of 104. Data are shown as in Figure 1D.
Figure 3.
Figure 3.
Activating Notch1 mutations and high NOTCH1 protein levels in SCL–LMO1 T-ALL are dependent on Cd3 gene status. (A) The Notch1 gene from Cd3ɛ+/+SCLtgLMO1tg and Cd3ɛ−/− SCLtgLMO1tg tumors was sequenced in three overlapping amplicons. Shown are the positions of the primers used in the sequencing reactions. HD, TAD, and PEST represent the heterodimerization, transactivation, and protein degradation domains, respectively. (B) NOTCH1 intracellular staining in Cd3ɛ+/+SCLtgLMO1tg and Cd3ɛ−/−SCLtgLMO1tg primary tumor samples. The average fluorescence intensity per pixel from Z-stack confocal analysis from two Cd3ɛ+/+SCLtgLMO1tg and three Cd3ɛ−/−SCLtgLMO1tg different tumor samples is shown as mean ± SD. (C) Quantitative RT–PCR of the indicated NOTCH1 target genes were performed in Cd3ɛ+/+SCLtgLMO1tg and Cd3ɛ−/−SCLtgLMO1tg tumors. Relative mRNA expression levels in tumor cells are normalized by CT values obtained with Cd3ɛ+/+SCLtgLMO1tg cells and are presented as box plots with the median and extreme values of each distribution ([*] P < 0.05; [**] P < 0.01; [***] P < 0.001 as compared with Cd3ɛ−/−SCLtgLMO1tg tumors). (D) The Notch1 gene from purified late preleukemic and leukemic thymocyte subsets from Cd3ɛ+/+ SCLtgLMO1tg mice was sequenced as in A. (ISP8 corresponds to Thy1.2+CD8+CD4Cd3ɛlo, SP4 corresponds to Thy1.2+CD4+CD8, and SP8 corresponds to Thy1.2+CD4CD8+.)
Figure 4.
Figure 4.
Genetic interaction between SCL, LMO1, and a hyperactive Notch1 allele in leukemogenesis. (A) Survival analysis of SCLtgLMO1tg, Notch1tg, Notch1tgSCLtg, Notch1tgLMO1tg, and Notch1tg SCLtgLMO1tg mice. Results are presented as in Figure 2A ([*] P < 0.001 as compared with SCLtgLMO1tg mice). Cohorts of n mice were analyzed per genotype. (B) Preleukemic and leukemic phenotypes of Notch1tg and Notch1tgSCLtgLMO1tg mice. Representative flow cytometry analysis of thymocytes was performed at the indicated times as in Figure 2B. (C) Oligoclonal T-cell expansion detected by PCR analysis of Tcrβ gene rearrangements in Notch1tg and Notch1tgSCLtgLMO1tg tumors. Genomic DNA was amplified by PCR with primers for specific variability segments of Tcrβ. Shown is germline configuration, rearrangements in wild-type thymus, and seven independent Notch1tgSCLtgLMO1tg and five independent Notch1tg tumors. (D) Leukemic cells from SCLtgLMO1tg and Notch1tg SCLtgLMO1tg were transplanted through limiting dilution in Rag1−/− mice. Shown is the time to leukemia after transplantation of the indicated numbers of LSC equivalent. LIC frequency (Range LIC ± SE) for the indicated genotype was calculated by applying Poisson statistics using the Limit Dilution Analysis software (Stem Cell Technologies). (E) Purified preleukemic thymocyte populations from 7-d-old SCLtgLMO1tg and Notch1tgSCLtgLMO1tg mice were transplanted into sublethally irradiated coisogenic Pep3B mice at a concentration of 3 × 10⁴. Shown are the numbers of mice presenting T-ALL 4 wk post-transplantation over the total numbers of transplanted mice. (F) Penetrance and median time to leukemia for SCLtgLMO1tg, Notch1tg SCLtgLMO1tg, Cd3ɛ−/− SCLtgLMO1tg, and Cd3ɛ−/−Notch1tgSCLtgLMO1tg.
Figure 5.
Figure 5.
Model of progression to leukemia. (A) At the time of weaning, thymic expression of the SCL–LMO1 oncogenes induces an expansion of the ETP/DN1 to DN4 population. A period of 92 d is necessary for acquisition of Notch1 gain-of-function mutations. The clonal expansion of the leukemic population takes another 31 d before overt leukemia. (B) The presence of all three oncogenes (Notch1, SCL, and LMO1) at birth is sufficient for full transformation of primary thymocyte precursors. The time to leukemia therefore represents the time required for clonal expansion.

Similar articles

Cited by

References

    1. Aifantis I, Raetz E, Buonamici S 2008. Molecular pathogenesis of T-cell leukaemia and lymphoma. Nat Rev Immunol 8: 380–390 - PubMed
    1. Aplan PD, Jones CA, Chervinsky DS, Zhao X, Ellsworth M, Wu C, McGuire EA, Gross KW 1997. An scl gene product lacking the transactivation domain induces bony abnormalities and cooperates with LMO1 to generate T-cell malignancies in transgenic mice. EMBO J 16: 2408–2419 - PMC - PubMed
    1. Armstrong SA, Staunton JE, Silverman LB, Pieters R, denBoer ML, Minden MD, Sallan SE, Lander ES, Golub TR, Korsmeyer SJ 2002. MLL translocations specify a distinct gene expression profile that distinguishes a unique leukemia. Nat Genet 30: 41–47 - PubMed
    1. Armstrong F, Brunet de la Grange P, Gerby B, Rouyez MC, Calvo J, Fontenay M, Boissel N, Dombret H, Baruchel A, Landman-Parker J, et al. 2009. NOTCH is a key regulator of human T-cell acute leukemia initiating cell activity. Blood 113: 1730–1740 - PubMed
    1. Begley CG, Aplan PD, Davey MP, Nakahara K, Tchorz K, Kurtzberg J, Hershfield MS, Haynes BF, Cohen DI, Waldmann TA, et al. 1989. Chromosomal translocation in a human leukemic stem-cell line disrupts the T-cell antigen receptor δ-chain diversity region and results in a previously unreported fusion transcript. Proc Natl Acad Sci 86: 2031–2035 - PMC - PubMed

Publication types

MeSH terms