

Screening cellular feature measurements for image-based assay development
- PMID: 20516293
- PMCID: PMC3145348
- DOI: 10.1177/1087057110370895
Screening cellular feature measurements for image-based assay development
Abstract
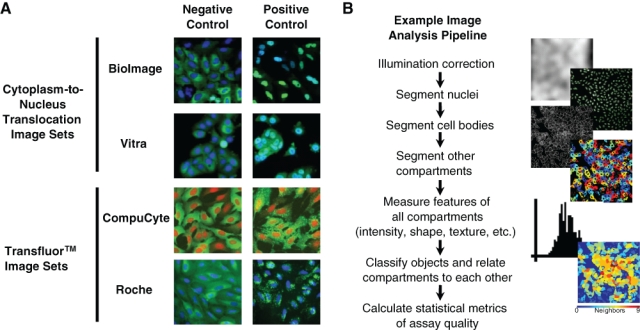
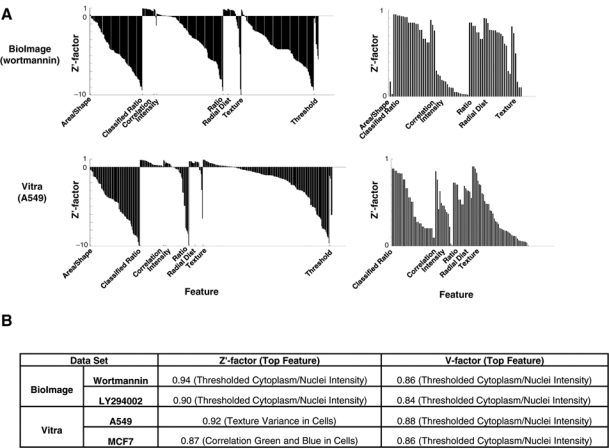
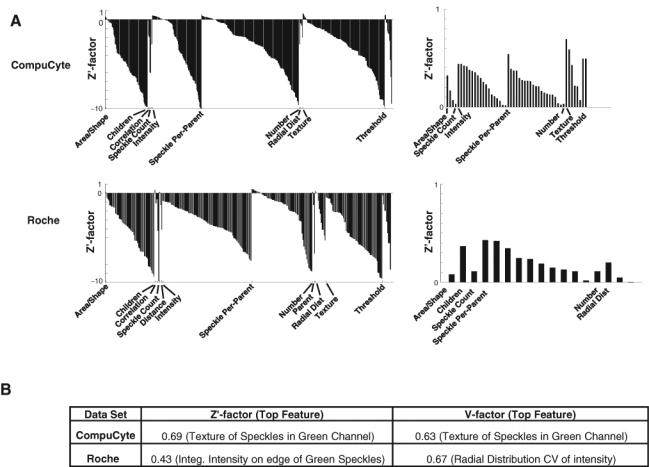
The typical "design" approach to image-based assay development involves choosing measurements that are likely to correlate with the phenotype of interest, based on the researcher's intuition and knowledge of image analysis. An alternate "screening" approach is to measure a large number of cellular features and systematically test each feature to identify those that are best able to distinguish positive and negative controls while taking precautions to avoid overfitting the available data. The cell measurement software the authors previously developed, CellProfiler, makes both approaches straightforward, easing the process of assay development. Here, they demonstrate the use of the screening approach to image assay development to select the best measures for scoring publicly available image sets of 2 cytoplasm-to-nucleus translocation assays and 2 Transfluor assays. The authors present the resulting assay quality measures as a baseline for future algorithm comparisons, and all software, methods, and images they present are freely available.
Figures
References
-
- Carpenter AE, Sabatini DM: Systematic genome-wide screens of gene function. Nat Rev Genet 2004;5:11-22 - PubMed
-
- Garippa R: A multi-faceted approach to the advancement of cell-based drug discovery. Drug Discov World 2004;6:43-55
-
- Pepperkok R, Ellenberg J: High-throughput fluorescence microscopy for systems biology. Nat Rev Mol Cell Biol 2006;7:690-696 - PubMed
-
- Wheeler DB, Carpenter AE, Sabatini DM. Cell microarrays and RNA interference chip away at gene function. Nat Genet 2005;37(suppl):S25-S30 - PubMed
-
- Gambe AE, Ono RM, Matsunaga S, Kutsuna N, Higaki T, Higashi T, Hasezawa S, et al. : Development of a multistage classifier for a monitoring system of cell activity based on imaging of chromosomal dynamics. Cytometry A 2007;71:286-296 - PubMed
Publication types
MeSH terms
Grants and funding
LinkOut - more resources
Full Text Sources
Other Literature Sources
