. 2010 Jul;120(7):2537-48.
doi: 10.1172/JCI41277.

HIV-1 Rev-binding protein accelerates cellular uptake of iron to drive Notch-induced T cell leukemogenesis in mice

Affiliations

HIV-1 Rev-binding protein accelerates cellular uptake of iron to drive Notch-induced T cell leukemogenesis in mice

Shariq S Khwaja et al. J Clin Invest. 2010 Jul.

Abstract

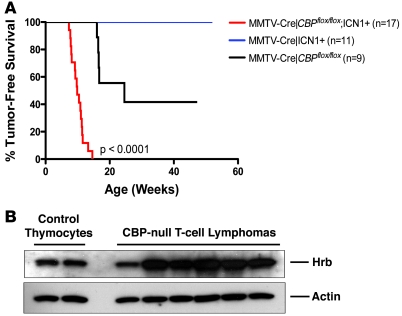
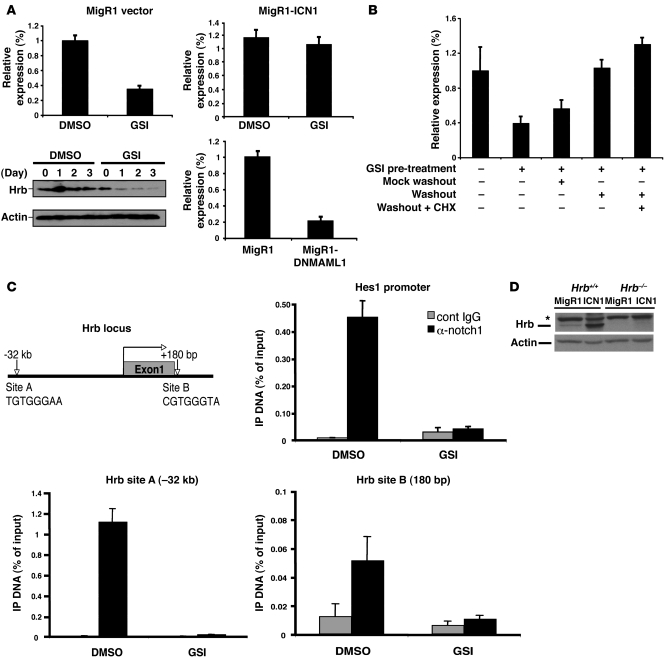
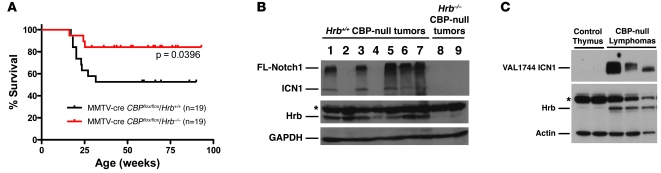
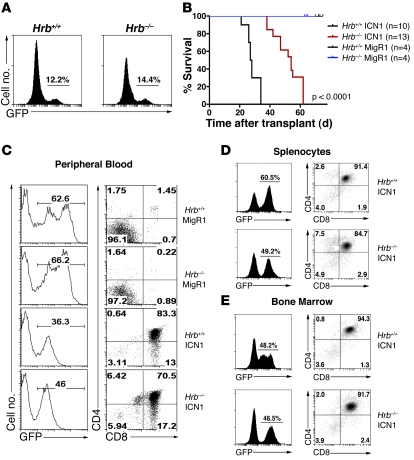
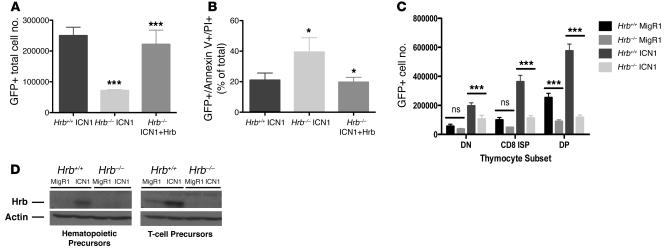
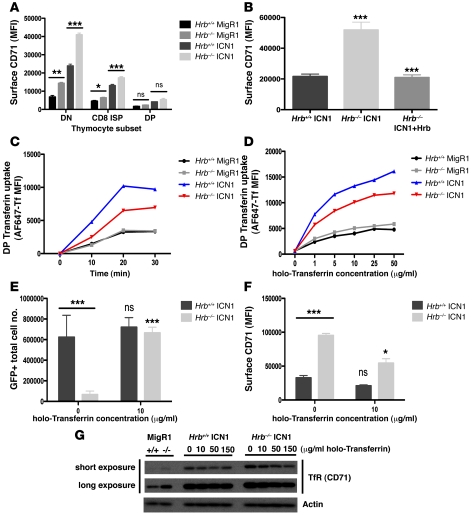
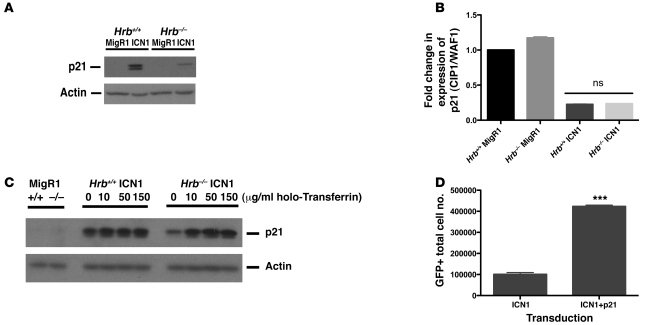
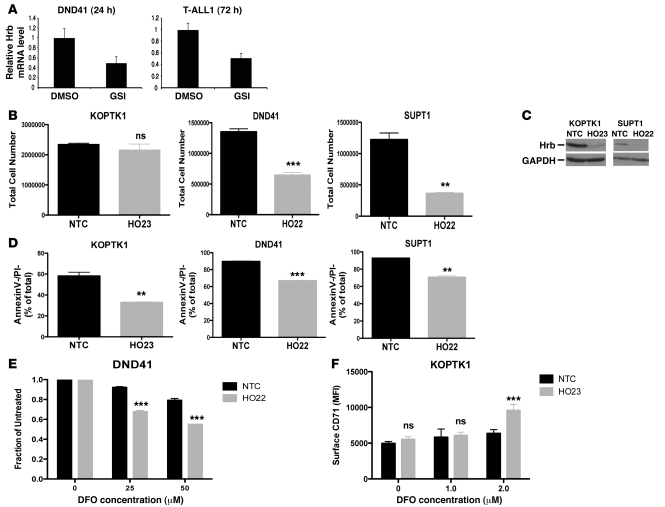
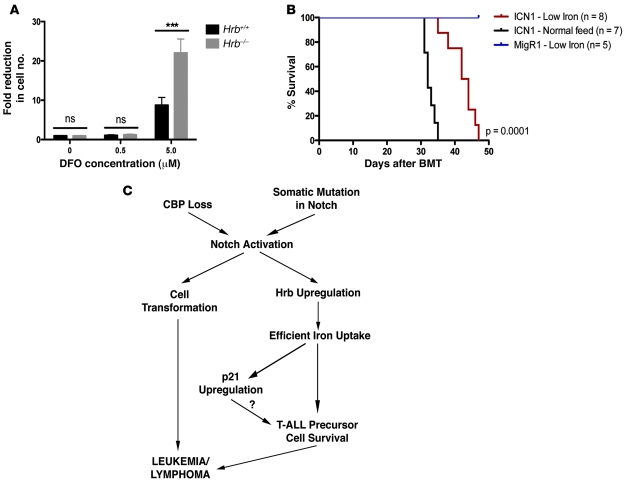
Somatic activating mutations in Notch1 contribute to the pathogenesis of T cell acute lymphoblastic lymphoma (T-ALL), but how activated Notch1 signaling exerts this oncogenic effect is not completely understood. Here we identify HIV-1 Rev-binding protein (Hrb), a component of the clathrin-mediated endocytosis machinery, as a critical mediator of Notch-induced T-ALL development in mice. Hrb was found to be a direct transcriptional target of Notch1, and Hrb loss reduced the incidence or delayed the onset of T-ALL in mouse models in which activated Notch1 signaling either contributes to or drives leukemogenesis. Consistent with this observation, Hrb supported survival and proliferation of hematopoietic and T cell precursor cells in vitro. We demonstrated that Hrb accelerated the uptake of transferrin, which was required for upregulation of the T cell protooncogene p21. Indeed, iron-deficient mice developed Notch1-induced T-ALL substantially more slowly than control mice, further supporting a critical role for iron uptake during leukemogenesis. Taken together, these results reveal that Hrb is a critical Notch target gene that mediates lymphoblast transformation and disease progression via its ability to satisfy the enhanced demands of transformed lymphoblasts for iron. Further, our data suggest that Hrb may be targeted to improve current treatment or design novel therapies for human T-ALL patients.


Figures

Figure 1
Figure 1. Notch activation cooperates with CBP loss to accelerate lymphomagenesis.
(A) Kaplan-Meier survival curve of mice with either (a) conditional deletion of CBPflox/flox via an MMTV-Cre mediated excision (n = 9), (b) transgenic expression of ICN1 via MMTV-Cre mediated excision of a floxed STOP sequence sandwiched between the chicken β-actin promoter and ICN1 coding sequence (n = 11), or (c) transgenic for ICN1 expression and CBP-null (n = 17). P < 0.0001 using log-rank (Mantel-Cox) test. ICN1 transgenic mice developed T cell lymphomas around 98 weeks. (B) Western blot of lysates prepared from control thymocytes and 6 CBP-null T cell lymphomas, blotting for Hrb (clone 386–562) and actin (loading control).
Figure 2
Figure 2. Hrb is a direct Notch1-regulated transcriptional target.
(A) A murine Notch-dependent cell line, T6E12, was utilized for Hrb mRNA and protein analysis. T6E12 cells were transduced with MigR1 (empty vector), MigR1-ICN1, or MigR1-DNMAML1 for 48 hours followed by 24 hours DMSO or GSI (1 μM) treatment as labeled. Hrb mRNA and protein levels were determined by quantitative RT-PCR and Western blot analysis, respectively. Results were obtained from 3 independent experiments. (B) T6E12 cells were treated with GSI (1 μM) for 48 hours to permit accumulation of the gamma-secretase substrate (transmembrane-Notch1 [NTM]). Cells were then washed and replenished with medium containing GSI (mock washout) or medium lacking GSI (washout) in the absence or presence of 20 μM cycloheximide (CHX). Hrb mRNA levels were evaluated by quantitative RT-PCR after 4 hours of additional incubation. Similar results were obtained in 3 independent experiments. (C) ChIP was performed on cross-linked fragmented DNAs prepared from T6E12 cells treated with DMSO or 1 μM GSI for 24 hours. Eluted DNAs were then analyzed by quantitative RT-PCR using primers flanking putative CSL-binding sites (A and B). Amplification of hes1 CSL-binding site served as a positive control to validate ChIP efficiency. The amount of DNA amplified from immunoprecipitated DNAs was normalized to that amplified from input DNA. (D) Western blot of lysates prepared from empty vector– (MigR1) and ICN1-transduced Hrb+/+ and Hrb–/– T cell precursors blotted for Hrb (clone H-300) and actin (loading control). Asterisk indicates nonspecific band. Data are shown as mean ± SD.
Figure 3
Figure 3. Hrb is required for efficient CBP-null lymphomagenesis.
(A) Kaplan-Meier survival curve of Hrb+/+ and Hrb–/– cohorts monitored over a period of 90 weeks. Hrb+/– mice on the background of MMTV-Cre/CBPflox/flox were intercrossed to generate Hrb+/+ and Hrb–/– mice with conditional loss of CBP. Mice were sacrificed once moribund and confirmed via dissection for the occurrence of T cell lymphoma (n = 19 for each cohort; P = 0.0396, log-rank Mantel-Cox test). (B) Western blot of lysates prepared from Hrb+/+ CBP-null tumors (n = 7) and Hrb–/– CBP-null tumors (n = 2). Membrane was blotted for Notch1 protein (clone mN1a), Hrb (clone H-300), and GAPDH (loading control). (C) Western blot of lysates prepared from CBP-null tumors (n = 3) and control thymocytes (n = 2). Membrane was blotted for activated Notch (VAL1744 Ab), Hrb (clone H-300), and actin (loading control). Asterisks indicate nonspecific bands.
Figure 4
Figure 4. Hrb is required for efficient ICN1-induced leukemogenesis.
(A) Analysis of GFP expression in Hrb+/+ and Hrb–/– BM after transduction with ICN1-expressing retrovirus and before transplantation into lethally irradiated recipients. Numbers in each GFP histogram refer to the GFP-positive percentage. (B) Kaplan-Meier survival curve of mice receiving Hrb+/+ ICN1–transduced BM (n = 10), Hrb–/– ICN1–transduced BM (n = 13), Hrb+/+ MigR1–transduced BM (n = 4), and Hrb–/– MigR1–transduced BM (n = 4). Statistical significance was established using the Mantel-Cox log rank analysis and showed a significant increase in survival in mice receiving Hrb–/– ICN1–transduced BM (P < 0.0001). Median time of survival after BMT for mice receiving Hrb+/+ ICN1–transduced BM was 27.5 days. Median time of survival after BMT for mice receiving Hrb–/– ICN1–transduced BM was 54 days. Mice receiving MigR1-transduced BM did not succumb to disease. (C) GFP analysis and CD4+CD8+ surface staining of peripheral blood cells isolated 15 days after BMT from mice receiving Hrb+/+ and Hrb–/– MigR1– and ICN1–transduced BM cells. (DE) GFP analysis and CD4+CD8+ surface staining of splenocytes (D) and BM cells (E) isolated from mice receiving Hrb+/+ and Hrb–/– ICN1–transduced BM cells. Numbers in GFP histograms refer to the percentage of GFP-positive cells. Numbers in each dot plot refer to the percentages in each quadrant.
Figure 5
Figure 5. Hrb is required for growth and survival of ICN1-transduced hematopoietic and T cell precursors.
(A) GFP-positive total cell number of Hrb+/+ ICN1–, Hrb–/– ICN1–, and Hrb–/– ICN1+Hrb–transduced hematopoietic precursor cells cocultured on OP9 stromal beds and harvested 7 days after transduction. (B) GFP-positive and annexin V and/or PI-positive percentages in Hrb+/+ ICN1–, Hrb–/– ICN1–, and Hrb–/– ICN1+Hrb–transduced hematopoietic precursor cells 7 days after transduction. (C) GFP-positive cell number of Hrb+/+ and Hrb–/– MigR1– and ICN1–transduced thymocytes grown on OP9DL1 stromal beds, harvested 5 days after transduction, and stained with antibodies to CD4 and CD8 to determine numbers in the CD4CD8 DN, CD4CD8+ ISP (CD8 ISP), or CD4+CD8+ DP subsets. (D) Western blot of lysates prepared from Hrb+/+ and Hrb–/– MigR1– and ICN1–transduced hematopoietic precursors (left) and Hrb+/+ and Hrb–/– MigR1– and ICN1–transduced T cell precursors (right) blotted for Hrb (clone H-300) and actin (loading control). Data are shown as mean ± SD. *P < 0.05; ***P < 0.001.
Figure 6
Figure 6. Hrb loss leads to increased surface TfR (CD71) and inefficient transferrin uptake in the context of oncogenic Notch signaling.
(A) Surface levels of TfR (CD71) on Hrb+/+ and Hrb–/– MigR1– and ICN1–transduced thymocytes cocultured on OP9DL1 stromal beds. (B) Surface levels of CD71 on Hrb+/+ and Hrb–/– MigR1– and ICN1–transduced hematopoietic precursor cells cocultured on OP9 stromal beds. (C) Uptake of 10 μg/ml Alexa Fluor 647–conjugated transferrin in Hrb+/+ and Hrb–/– MigR1– and ICN1–transduced DP thymocytes. (D) Uptake of Alexa Fluor 647–conjugated transferrin (0–50 μg/ml) in Hrb+/+ and Hrb–/– MigR1– and ICN1–transduced DP thymocytes. Uptake experiments repeated several times with representative graphs shown here. Each point on the curves represents an independently transduced well in the experiment. (E) Hrb+/+ and Hrb–/– ICN1–transduced GFP-positive hematopoietic precursors with and without holo-Tf addition. (F) Surface CD71 levels on GFP-positive Hrb+/+ and Hrb–/– ICN1–transduced hematopoietic precursors treated as in panel E. (EF) Hrb+/+ and Hrb–/– 10 μg/ml holo-Tf samples were compared with respective 0 μg/ml holo-Tf samples. (G) Western blot of lysates prepared from Hrb+/+ and Hrb–/– MigR1–transduced thymocytes and Hrb+/+ and Hrb–/– ICN1–transduced thymocytes grown on OP9DL1 cocultures in the presence of increasing concentrations of holo-Tf. Lysates blotted for TfR: short exposure (top); longer exposure (bottom); and actin (loading control). DN, CD4CD8 DN; CD8 ISP, CD4CD8+ ISP; DP, CD4+CD8+ DP. Data are shown as mean ± SD. *P < 0.05; **P < 0.01; ***P < 0.001.
Figure 7
Figure 7. Addition of excess holo-transferrin restores p21 protein levels in ICN1-transduced Hrb–/– T cell precursors.
(A) Western blot of lysates prepared from Hrb+/+ and Hrb–/– MigR1– and ICN1–transduced thymocytes grown on OP9DL1 cocultures and harvested 5 days after transduction. Lysates blotted for p21 and actin (loading control). (B) Quantitative RT-PCR of mRNA isolated from the Hrb+/+ and Hrb–/– MigR1– and ICN1–transduced thymocytes grown as in panel A. (C) Western blot of lysates from Figure 6G blotted for p21 and actin (loading control). (D) GFP-positive cell number of ICN1- and ICN1+p21–transduced WT hematopoietic precursors cocultured on OP9 stromal beds for 10 days. Data are shown as mean ± SD. ***P < 0.001.
Figure 8
Figure 8. Hrb is regulated by Notch signaling in human T-ALL cell lines and is required for cell proliferation and survival.
(A) Quantitative RT-PCR analysis demonstrating the downregulation of Hrb following treatment with GSI (1 μM). Human T-ALL cell lines DND41 and T-ALL1 were treated with DMSO or GSI for 24 hours and 72 hours, respectively. Total RNA was prepared for reverse transcription and human Hrb mRNA abundance was measured by quantitative RT-PCR. (B) Nontarget control (NTC) and Hrb knockdown (HO22/HO23) stably transduced T-ALL cell lines were seeded at 100,000 cells/well and cultured for 7 days. Total cell numbers were counted based on forward and side scatter. (C) Western blot of lysates prepared from KOPTK1 and SUPT1 cell lines stably transduced with nontarget control and HO22/HO23 Hrb knockdown lentiviral vectors. Membranes were blotted with Hrb (clone H-300) and GAPDH (loading control). (D) Nontarget control and Hrb knockdown (HO22/HO23) stably-transduced T-ALL cell lines were seeded at 100,000 cells/well and cultured for 7 days. Cell survival was assessed using annexin V/PI staining. (E) DFO sensitivity of DND41 cells stably transduced with nontarget control or HO22. nontarget control or HO22 DND41 T-ALL cells were treated with 0, 25, or 50 μM DFO for 4 days. Following treatment, total cell numbers were acquired based on forward/side scatter and normalized to untreated. (F) Surface CD71 levels on NTC and HO23 stably transduced KOPTK1 cells treated with 0, 1.0, and 2.0 μM DFO. Data are shown as mean ± SD. **P < 0.01; ***P < 0.001.
Figure 9
Figure 9. Iron is critical for T cell precursor development and for ICN1-induced leukemogenesis.
(A) Hrb+/+ and Hrb–/– CD4CD8 DN cells were seeded on OP9DL1 stromal beds. DFO was added at 0.5 and 5.0 μM 2 days after cells were plated. Total cell numbers were counted 2 days after treatment. Fold reduction in cell number was calculated in relationship to 0 μM DFO. (B) Lethally irradiated recipient mice received 25,000 ICN1-transduced BM cells. 7 mice were given normal feed, and 8 mice were given a low-iron diet immediately after transplant and were maintained on their respective diets. Additionally, 5 recipient mice that were transplanted with 25,000 MigR1-transduced BM cells were kept on the same low-iron diet as controls. Maintenance on a low-iron diet delayed death by ICN1-induced leukemogenesis (P = 0.0001 using log-rank Mantel-Cox test). (C) Model for the role of Hrb in oncogenic Notch signaling: Notch activation after loss of CBP or somatic mutation of Notch1 can lead to Hrb upregulation and cell transformation. Hrb upregulation is required for efficient transferrin uptake, resulting in increased intracellular iron for the transformed cell. This increase in iron uptake leads to increased p21 protein levels. Together, these molecular changes contribute to the survival and proliferation of the Notch-transformed cell, resulting in leukemia. Data are shown as mean ± SD. ***P < 0.001.

Similar articles

Cited by

References

    1. Aster JC, Pear WS, Blacklow SC. Notch signaling in leukemia. Annu Rev Pathol. 2008;3:587–613. doi: 10.1146/annurev.pathmechdis.3.121806.154300. - DOI - PMC - PubMed
    1. Bray SJ. Notch signalling: a simple pathway becomes complex. Nat Rev Mol Cell Biol. 2006;7(9):678–689. doi: 10.1038/nrm2009. - DOI - PubMed
    1. Ellisen LW, et al. TAN-1, the human homolog of the Drosophila notch gene, is broken by chromosomal translocations in T lymphoblastic neoplasms. Cell. 1991;66(4):649–661. doi: 10.1016/0092-8674(91)90111-B. - DOI - PubMed
    1. Weng AP, et al. Activating mutations of NOTCH1 in human T cell acute lymphoblastic leukemia. Science. 2004;306(5694):269–271. doi: 10.1126/science.1102160. - DOI - PubMed
    1. Izon DJ, et al. Notch1 regulates maturation of CD4+ and CD8+ thymocytes by modulating TCR signal strength. Immunity. 2001;14(3):253–264. doi: 10.1016/S1074-7613(01)00107-8. - DOI - PubMed

Publication types

MeSH terms