

Poverty and racial disparities in kidney disease: the REGARDS study
- PMID: 20516678
- PMCID: PMC2914392
- DOI: 10.1159/000313883
Poverty and racial disparities in kidney disease: the REGARDS study
Abstract
There are pronounced disparities among black compared to white Americans for risk of end-stage renal disease. This study examines whether similar relationships exist between poverty and racial disparities in chronic kidney disease (CKD) prevalence.
Methods: We studied 22,538 participants in the REasons for Geographic And Racial Differences in Stroke (REGARDS) cohort study. We defined individual poverty as family income below USD 15,000 and a neighborhood as poor if 25% or more of the households were below the federal poverty level.
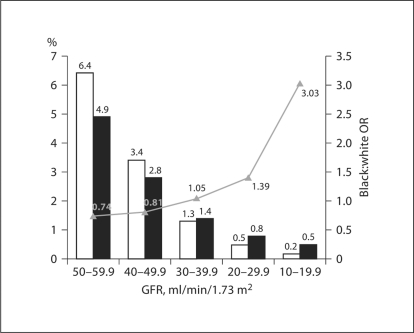
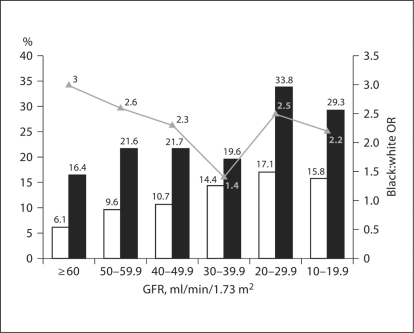
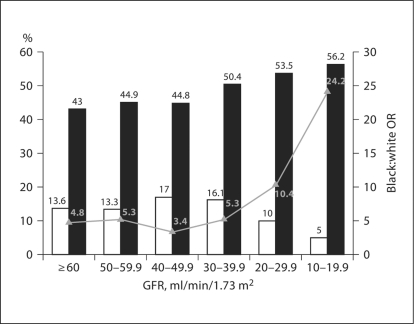
Results: As the estimated glomerular filtration rate (GFR) declined from 50-59 to 10-19 ml/min/ 1.73 m2, the black:white odds ratio (OR) for impaired kidney function increased from 0.74 (95% CI 0.66, 0.84) to 2.96 (95% CI 1.96, 5.57). Controlling for individual income below poverty, community poverty, demographic and comorbid characteristics attenuated the black:white prevalence to an OR of 0.65 (95% CI 0.57, 0.74) among individuals with a GFR of 59-50 ml/min/1.73 m2 and an OR of 2.21 (95% CI 1.25, 3.93) among individuals with a GFR between 10 and 19 ml/min/ 1.73 m2.
Conclusion: Household, but not community poverty, was independently associated with CKD and attenuated but did not fully account for differences in CKD prevalence between whites and blacks.
Copyright 2010 S. Karger AG, Basel.
Figures
References
-
- US Renal Data System, USRDS 2004 Annual Data Report . Atlas of End-Stage Renal Disease in the United States. Bethesda: National Institutes of Health, National Institute of Diabetes and Digestive and Kidney Diseases; 2004.
-
- Whittle JC, Whelton PK, Seidler AJ, Klag MJ. Does racial variation in risk factors explain black-white differences in the incidence of hypertensive end-stage renal disease? Arch Intern Med. 1991;151:1359–1364. - PubMed
-
- Brancati FL, Whittle JC, Whelton PK, Seidler AJ, Klag MJ. The excess incidence of diabetic end-stage renal disease among blacks. A population-based study of potential explanatory factors. JAMA. 1992;268:3079–3084. - PubMed
-
- Powe NR, Tarver-Carr ME, Eberhardt MS, Brancati FL. Receipt of renal replacement therapy in the United States: a population-based study of sociodemographic disparities from the Second National Health and Nutrition Examination Survey (NHANES II) Am J Kidney Dis. 2003;42:249–255. - PubMed
-
- Klag MJ, Whelton PK, Randall BL, Neaton JD, Brancati FL, Stamler J. End-stage renal disease in African-American and white men. 16-year MRFIT findings. JAMA. 1997;277:1293–1298. - PubMed
Publication types
MeSH terms
Substances
Grants and funding
LinkOut - more resources
Full Text Sources
Medical
Research Materials
