Comparative Study
. 2010 May 24;2(2):e00034.
doi: 10.1042/AN20100005.

The neurogenic basic helix-loop-helix transcription factor NeuroD6 confers tolerance to oxidative stress by triggering an antioxidant response and sustaining the mitochondrial biomass

Affiliations
Comparative Study

The neurogenic basic helix-loop-helix transcription factor NeuroD6 confers tolerance to oxidative stress by triggering an antioxidant response and sustaining the mitochondrial biomass

Martine Uittenbogaard et al. ASN Neuro. .

Abstract

Preserving mitochondrial mass, bioenergetic functions and ROS (reactive oxygen species) homoeostasis is key to neuronal differentiation and survival, as mitochondria produce most of the energy in the form of ATP to execute and maintain these cellular processes. In view of our previous studies showing that NeuroD6 promotes neuronal differentiation and survival on trophic factor withdrawal, combined with its ability to stimulate the mitochondrial biomass and to trigger comprehensive antiapoptotic and molecular chaperone responses, we investigated whether NeuroD6 could concomitantly modulate the mitochondrial biomass and ROS homoeostasis on oxidative stress mediated by serum deprivation. In the present study, we report a novel role of NeuroD6 as a regulator of ROS homoeostasis, resulting in enhanced tolerance to oxidative stress. Using a combination of flow cytometry, confocal fluorescence microscopy and mitochondrial fractionation, we found that NeuroD6 sustains mitochondrial mass, intracellular ATP levels and expression of specific subunits of respiratory complexes upon oxidative stress triggered by withdrawal of trophic factors. NeuroD6 also maintains the expression of nuclear-encoded transcription factors, known to regulate mitochondrial biogenesis, such as PGC-1alpha (peroxisome-proliferator-activated receptor gamma co-activator-1alpha), Tfam (transcription factor A, mitochondrial) and NRF-1 (nuclear respiratory factor-1). Finally, NeuroD6 triggers a comprehensive antioxidant response to endow PC12-ND6 cells with intracellular ROS scavenging capacity. The NeuroD6 effect is not limited to the classic induction of the ROS-scavenging enzymes, such as SOD2 (superoxide dismutase 2), GPx1 (glutathione peroxidase 1) and PRDX5 (peroxiredoxin 5), but also to the recently identified powerful ROS suppressors PGC-1alpha, PINK1 (phosphatase and tensin homologue-induced kinase 1) and SIRT1. Thus our collective results support the concept that the NeuroD6-PGC-1alpha-SIRT1 neuroprotective axis may be critical in co-ordinating the mitochondrial biomass with the antioxidant reserve to confer tolerance to oxidative stress.

Keywords: AD, Alzheimer’s disease; AM, acetoxymethyl ester; COX, cytochrome c oxidase; DAPI, 4′,6-diamidino-2-phenylindole; DIC, differential interference contrast; Drp1, dynamin-related protein 1; ETC, electron transfer chain; GABP-α, GA-binding protein-α; GAPDH, glyceraldehyde-3-phosphate dehydrogenase; GFP, green fluorescent protein; GPx1, glutathione peroxidase 1; HSP, heat-shock protein; MMP, mitochondrial membrane potential; MTG, MitoTracker® Green; MTR, MitoTracker® Red; Mfn2, mitofusin 2; Mg-Gr, Magnesium Green; NRF, nuclear respiratory factor; NT-PGC-1α, N-terminal-truncated PGC-1α; NeuroD family; OPA1, optic atrophy 1; OXPHOS, oxidative phosphorylation; PDL, poly-d-lysine; PGC-1α, peroxisome-proliferator-activated receptor γ co-activator-1α; PINK1, phosphatase and tensin homologue-induced kinase 1; PRDX5, peroxiredoxin 5; ROS, reactive oxygen species; SIRT1; SOD, superoxide dismutase; Tfam, transcription factor A, mitochondrial; WGA, wheatgerm agglutinin; bHLH, basic helix–loop–helix; mitochondria; mtDNA, mitochondrial DNA; neuronal survival; reactive oxygen species (ROS); transcriptional co-regulator peroxisome-proliferator-activated receptor γ co-activator-1α (PGC-1α).


Figures
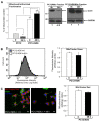
Figure 1
Figure 1. Constitutive expression of NeuroD6 results in sustained mitochondrial biomass upon serum deprivation
(A) Whereas PC12-ND6 cells retained their mitochondrial protein content after 48 h of serum deprivation, control PC12 cells lost more than half of their mitochondrial protein content after 24 h of serum deprivation. Mitochondrial-enriched fractions were isolated from serum-grown control PC12 and PC12-ND6 cells (t = 0) and serum-deprived control PC12 (t = 24 h) and PC12-ND6 (t = 48 h) cells. The protein content of mitochondrial fractions is expressed as a percentage of total protein content of the corresponding whole cell extract (left-hand panel). Data are expressed as the means±S.D. from three independent experiments (*P = 0.0002 as compared with serum-grown control PC12 cells; **P = 0.0001 as compared with serum-deprived control PC12 cells; ***P = 0.0153 as compared with serum-grown PC12-ND6 cells; ‡P = 0.0001 as compared with serum-deprived control PC12 cells). Expression levels of COX4 remained constant in mitochondrial-enriched fractions of PC12-ND6 cells after 48 h of serum deprivation (right-hand panel). Immunoblot analysis was performed using mitochondrial-enriched fractions isolated from serum-grown (0 h) and serum-deprived (24 h) control PC12 as well as serum-grown (0 h) and serum-deprived (48 h) PC12-ND6 cells using a monoclonal antibody against COX4. Equal loading was verified using an anti-GAPDH antibody. Molecular mass markers are indicated in kDa on the left side of each Western blot panel. Results shown are representative of three independent experiments. Indicated quantification values are specific to the blot shown, with an S.D. less than 10% compared with the corresponding replicates. (B) Quantification of the fluorescence intensity of serum-grown and serum-deprived PC12-ND6 labelled with the mitochondrial dye MTG. PC12-ND6 cells were first grown in a serum-containing medium before being serum-deprived for 48 h. PC12-ND6 cells were then stained with MTG (70 nM) and analysed by flow cytometry. Flow cytometric profiles of serum-grown (t = 0) and serum-deprived (t = 48 h) PC12-ND6 labelled with MTG (left panel). Data are expressed as means±S.D. from five independent experiments (right panel). There was no statistical difference in the mitochondrial biomass of serum-deprived PC12-ND6 cells, as compared with serum-grown PC12 cells. (C) The mitochondrial area of PC12-ND6 cells remains constant after 2 days of serum deprivation. To stain the mitochondrial compartment, serum-grown (t = 0) and serum-deprived (t = 48 h) PC12-ND6 cells were labelled with MTR (red) and the plasma membrane marker Alexa Fluor® 488-conjugated WGA (green) and TO-PRO®-3® (blue) (left panel; scale bar, 10 μm). The right panel illustrates the quantification of mitochondrial area in serum-grown and serum-deprived PC12-ND6 cells. Data are expressed as the means±S.D. for three independent experiments with a minimum of n = 150 cells for each culture condition. No statistically significant variation of the mitochondrial area was observed on serum deprivation of PC12-ND6 cells.
Figure 2
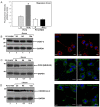
Figure 2. Serum-deprived PC12-ND6 cells sustain intracellular ATP levels and expression levels of specific subunits of the respiratory complexes I, III and V
(A) Intracellular ATP levels of PC12-ND6 cells remained constant after 2 days of serum deprivation, while serum-deprived control PC12 cells (for 24 h) lost half of their original ATP levels. Serum-grown and serum-deprived control PC12 and PC12-ND6 cells were labelled with Mg-Gr-AM (10 μM) for 30 min at 37°C before being analysed with a FACSCalibur™ flow cytometer. Data were collected from 20000 cells and three independent experiments. Mg-Gr decreases emission intensity (λex = 475 nm; λem = 530 nm) with an increase in ATP levels due to its high binding affinity to ATP, as compared with that of ADP. Results are expressed as relative fluorescence intensity. No statistically significant difference in intracellular ATP levels was observed after 2 days of serum deprivation (P = 0.7992). (B) The α-subunit of the ATP synthase (COXV) remains steadily expressed throughout the duration of serum deprivation in PC12-ND6 cells. Immunoblot analysis was performed using whole-cell extracts from serum-grown PC12-ND6 cells and PC12-ND6 cells serum-deprived for the indicated periods of time. Equal loading was verified using an anti-GAPDH antibody. Molecular masses in kDa are indicated on the left side of each Western blot panel. The left-hand panel shows immunoblot results representative of three independent experiments. Indicated quantification values are specific to the blot shown, with an S.D. less than 10% compared with the corresponding replicates. The right-hand panel illustrates the representative immunocytochemistry showing the retained mitochondrial localization of the α-subunit of the ATP synthase (COX5) on serum deprivation (scale bar, 10 μm). (C) The subunit NDUFA9 of complex I remains expressed throughout the duration of serum deprivation in PC12-ND6 cells, albeit at lower levels after 6 days of serum removal. The left-hand panel shows immunoblot results representative of at least three independent experiments. Indicated quantification values are specific to the blot shown, with an S.D. less than 10% compared with the corresponding replicates. The right-hand panel illustrates representative immunocytochemistry showing the retained mitochondrial localization of the subunit NDUFA9 upon serum deprivation. Cells were labelled with an anti-NDUFA9 monoclonal antibody and the nuclear counterstain DAPI before being analysed by confocal fluorescence microscopy (scale bar, 10 μm). (D) The core2 protein of COX3 remains expressed throughout the duration of serum deprivation in PC12-ND6 cells. The left-hand panel shows immunoblot results representative of three independent experiments. Indicated quantification values are specific to the blot shown, with an S.D. less than 10% compared with the corresponding replicates. The right-hand panel illustrates the representative immunocytochemistry showing the retained mitochondrial localization of the core2 protein of COX3 on serum deprivation (scale bar, 10 μm).
Figure 3
Figure 3. Analysis of mitochondrial morphology by live cell imaging and expression levels of proteins involved in mitochondrial fusion and fission prior to and after serum removal
(A) Live cell confocal fluorescence imaging of serum-grown and serum-deprived PC12-ND6 cells. PC12-ND6 cells were first transfected with the mito-GFP vector to label the mitochondrial mass and then switched to a serum-free medium for the indicated periods of time. Mitochondrial morphology was assessed by confocal fluorescence microscopy using a ×100 oil objective and an environmental chamber to keep the CO2 level and temperature constant. The left panels show GFP-labelled mitochondria, while the middle panels show the merge with the corresponding DIC pictures. The right panels show high magnification of the labelled mitochondria (large arrows for elongated mitochondria and small for rod-like mitochondria). Scale bar, 5 μm. (B) High magnification of serum-deprived PC12-ND6 cells transfected with the mito-GFP vector. This image illustrates the range of mitochondrial length, suggestive of a dynamic fusion–fission activity even after 15 days of serum deprivation. Scale bar, 5 μm. (C) Expression profile of protein involved in the fusion–fission process of mitochondria. Immunoblot analyses were performed using whole-cell extracts from serum-grown control PC12 and PC12-ND6 cells and equal loading was verified using an anti-GAPDH antibody. Relevant molecular masses (in kDa) are indicated on the left side of each Western blot panel. The immunoblots are representative of at least three independent experiments. Indicated quantification values are specific to the blot shown, with an S.D. less than 10% compared with the corresponding replicates. (D) Full-length PINK1 protein remains expressed in serum-deprived PC12-ND6 cells, even after 15 days of serum deprivation. Immunoblot analysis was performed using whole-cell extracts from PC12-ND6 cells grown in a serum-free medium for the indicated periods of time. Equal loading was verified using an anti-GAPDH antibody. Relevant molecular masses (in kDa) are indicated on the left side of the Western blot panels. Results shown are representative of three independent experiments. Indicated quantification values are specific to the blot shown, with an S.D. less than 10% compared with the corresponding replicates.
Figure 4
Figure 4. Expression pattern of key regulators involved in mitochondrial biogenesis upon serum deprivation
The immunoblots are representative of three independent experiments. Equal loading was verified using an anti-GAPDH antibody and the relevant molecular masses (in kDa) are indicated on the left side of each Western blot panel. Indicated quantification values are specific to the blot shown, with an S.D. less than 10% compared with the corresponding replicates. (A) Only the expression levels of the truncated form of PGC-1α, NT-PGC-1α, remain unaltered throughout serum deprivation of PC12-ND6 cells. The asterisks indicate isoforms of the full-length PGC-1α. Quantification pertains to the full length of PGC-1α. (B) Tfam expression levels in PC12-ND6 cells were unaffected by serum deprivation. The mitochondrial-specific form of Tfam was the main form detected in both serum-grown and serum-deprived PC12-ND6 cells. (C) Levels of NRF-1 expression remained steady throughout serum deprivation of PC12-ND6 cells. (D) Levels of NRF2 expression collapsed 2 days after serum deprivation of PC12-ND6 cells.
Figure 5
Figure 5. Constitutive expression of NeuroD6 prevents ROS production upon serum deprivation
(A, B) Live cell confocal images of control PC12 and PC12-ND6 cells grown in the presence or absence of serum for 24 h before being labelled with the MitoSOX™ dye (red) and the nuclear counterstain Hoechst 33342 (blue). Images are representative of three independent experiments. The left panels illustrate MitoSOX™-labelled cells before (t = 0) and after serum deprivation (t = 24 h), while the right panels show the merge with the corresponding DIC pictures (scale bar, 10 μm). (C) Quantification of ROS production at different time points of serum deprivation for control PC12 and PC12-ND6 cells. The mean fluorescence intensity of MitoSOX™ labelling was measured in the presence or absence of serum for 6 and 24 h in control PC12 and PC12-ND6 cells and for 48 h in PC12-ND6 cells. At the outset of serum deprivation, we did not observe any statistical difference of ROS production between control PC12 and PC12-ND6 cells (P = 0.6074). The graph represents the averages from 150 cells from three independent experiments. ‡P = 0.0077 as compared with serum-grown control PC12 cells; *P = 0.0098 as compared with serum-deprived control PC12 cells for 6 h; **P = 0.0004 as compared with serum-deprived control PC12 cells for 24 h; ***P = 0.0207 as compared with untreated PC12-ND6 cells.
Figure 6
Figure 6. NeuroD6 triggers an antioxidant response in the absence of stress, which remains expressed throughout serum deprivation
The immunoblots are representative of three independent experiments. Equal loading was verified using an anti-GAPDH antibody. Indicated quantification values are specific to the blot shown, with an S.D. less than 10% compared with the corresponding replicates. (A) Constitutive expression of NeuroD6 results in increased expression of SOD1 and SOD2 in the absence of stress stimulus, which remains unaltered during oxidative stress mediated by serum deprivation. (B) Expression levels of the antioxidant regulators, Gpx1 and Prdx5, are increased upon constitutive expression of NeuroD6 and throughout the duration of serum deprivation treatment. (C) SIRT1 expression increases in the absence of stress stimulus in serum-grown PC12-ND6 cells, while remaining constant for up to 6 days of serum deprivation. Relevant molecular masses in kDa are indicated on the left side of each Western blot panel.
Figure 7
Figure 7. Working model of NeuroD6-mediated tolerance to oxidative stress
This comprehensive working model integrates newly identified transcriptional modules with modules identified in our published studies (Uittenbogaard and Chiaramello, 2004, 2005; Baxter et al., 2009; Uittenbogaard et al., 2010), as indicated with asterisks. Whereas representative markers for each module are indicated in blue-framed boxes, the corresponding cellular processes are specified in blue elliptical objects.

Similar articles

Cited by

References

    1. Balaban RS, Nemoto S, Finkel T. Mitochondria, oxidants, and aging. Cell. 2005;120:483–495. - PubMed
    1. Banmeyer I, Marchand C, Clippe A, Knoops B. Human mitochondrial peroxiredoxin 5 protects from mitochondrial DNA damages induced by hydrogen peroxide. FEBS Lett. 2005;579:2327–2333. - PubMed
    1. Banmeyer I, Marchand C, Verhaeghe C, Vucic B, Rees JF, Knoops B. Overexpression of human peroxiredoxin 5 in subcellular compartments of chinese hamster ovary cells: Effects on cytotoxicity and DNA damage caused by peroxides. Free Radical Biol Med. 2004;36:65–77. - PubMed
    1. Bartholomä A, Nave KA. NEX-1: a novel brain-specific helix–loop–helix protein with autoregulation and sustained expression in mature cortical neurons. Mech Dev. 1994;48:217–228. - PubMed
    1. Batchelor AH, Piper DE, de la Brousse FC, McKnight SL, Wolberger C. The structure of GABPalpha/beta: an ETS domain–ankyrin repeat heterodimer bound to DNA. Science. 1998;279:1037–1041. - PubMed

Publication types

MeSH terms

Substances