. 2008 Jul 15;3(1-2):125-52.
doi: 10.2478/v10053-008-0020-5.

The role of feedback in visual masking and visual processing

Affiliations

The role of feedback in visual masking and visual processing

Stephen L Macknik et al. Adv Cogn Psychol. .

Abstract

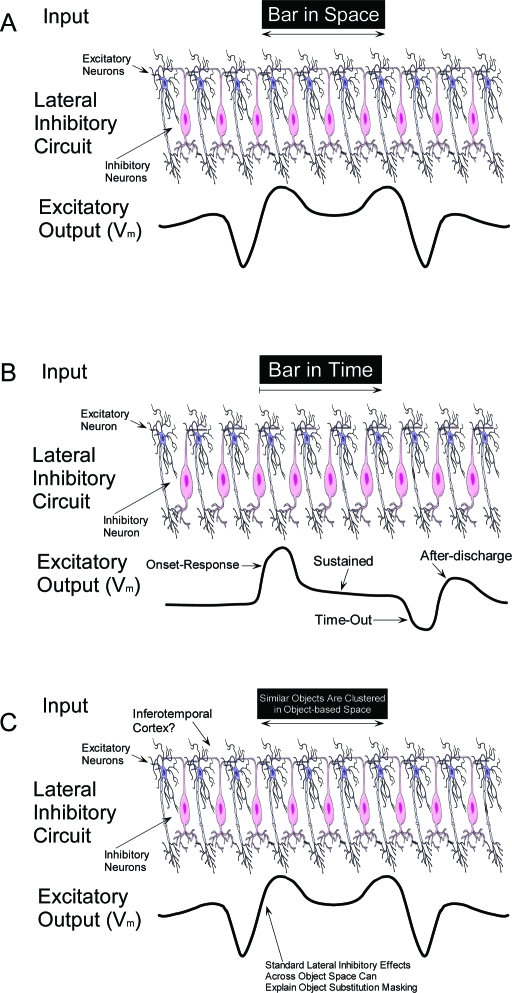
This paper reviews the potential role of feedback in visual masking, for and against. Our analysis reveals constraints for feedback mecha- nisms that limit their potential role in visual masking, and in all other general brain functions. We propose a feedforward model of visual masking, and provide a hypothesis to explain the role of feedback in visual masking and visual processing in general. We review the anato-my and physiology of feedback mechanisms, and propose that the massive ratio of feedback versus feedforward connections in the visual system may be explained solely by the critical need for top-down attentional modulation. We discuss the merits of visual masking as a tool to discover the neural correlates of consciousness, especially as compared to other popular illusions, such as binocular rivalry. Finally, we propose a new set of neurophysiological standards needed to establish whether any given neuron or brain circuit may be the neural substrate of awareness.

Keywords: attention; awareness; consciousness; electrophysiology; fMRI; feedback; humans; masking; metacontrast; monkeys; optical imaging; paracontrast; psychophysics; standing wave; vision; visual.


Figures

Figure 1.
Figure 1.
Perception of a target and mask with respect to temporal arrangement. Reprinted from Macknik (2006).
Figure 2.
Figure 2.
(A) The sequence of events during the course of a visual masking psychophysics trial. The trial started with a delay of 500 to 1500 msec. In backward masking conditions, the target was presented, followed by the mask. In forward masking conditions, masks came before targets. After termination of the second stimulus (mask or target) there was another 500 msec delay, after which the subject indicated which side had the longer target. (B) A schematic view of the various timing parameters used. SOA = Stimulus Onset Asynchrony, the interval between the onset of target and of mask; STA = Stimulus Termination Asynchrony, the interval between termination of target and of mask; ISI = Inter-Stimulus Interval, between the termination of the target and the onset of the mask (backward masking) or between the termination of the mask and the onset of the target (forward masking). Reprinted from Macknik & Livingstone (1998).
Figure 3.
Figure 3.
Psychophysical measurements of the timing parameters important for visual masking. “T” represents the duration (in milliseconds) of the target and “M” represents the duration of the mask. Results represent average for 25 subjects. (A) Results from backward masking conditions plotted on a stimulus onset asynchrony (SOA) scale. Note that the points of peak masking (the x-intercepts of the drop-lines) are widely dispersed. (B) Results from panel A replotted here as a function of inter-stimulus interval (ISI). The points of peak masking tend to cluster in two places, correlated with mask duration (open symbols vs. closed symbols). (C) Results from panel A replotted here on a stimulus termination asynchrony (STA) scale. The points of maximal masking are no longer dispersed, and instead cluster around an STA of about 100 ms +/- 20 ms. (D) Linear regression (with 95% confidence intervals) of peak backward masking times in terms of SOA when the mask was 50 ms in duration. (E) The amount of dispersion of peak backward masking times for data tested on a scale of stimulus termination asynchrony (STA), inter-stimulus interval (ISI), and stimulus onset asynchrony (SOA). Notice that the peak backward masking times are least dispersed on an STA scale. Thus STA is the best predictor of backward masking. (F) Results from forward masking conditions; the optimal predictor of peak masking is the ISI between the termination of the mask and the onset of the target. Reprinted from Macknik & Livingstone (1998).
Figure 4.
Figure 4.
Multi-unit recording from upper layers of area V1 in an anesthetized rhesus monkey. The aggregate receptive field was foveal, 0.1° square, and well-oriented. In contrast to the recordings from alert animals, where eye movements occur frequently, the mask was largely outside the receptive field. The vertical bars (gray for mask, black for target), indicate the onset time of the stimuli. Notice that under conditions that best correlate with human forward masking (ISI = 0 ms, here corresponding to SOA = -100 ms) the main effect of the mask is to inhibit the transient onset-response to the target. Similarly, in the condition that produces maximum backward masking in humans (STA = 100 ms; here corresponding to SOA = 100 ms for the 100 ms stimulus on the left, SOA = 500 for the 500 ms stimulus on the right), the after-discharge is specifically inhibited. Each histogram is an average of 50 trials with a bin width of 5ms. Modified from Macknik & Livingstone (1998).
Figure 5.
Figure 5.
Recording from a typical single neuron from monkey area V1 that was stimulated with a target of various durations. The magnitude of the after-discharge grows as the target duration increases. Reprinted from Macknik & Martinez-Conde (2004a).
Figure 6.
Figure 6.
(A) A representation of the spatial lateral inhibition model originally proposed by Hartline and Ratliff (Ratliff, 1961; Ratliff et al., 1974). The excitatory neurons in the center of the upper row receive excitatory input from a visual stimulus. This excitation is transmitted laterally in the form of inhibition, resulting in edge enhancement of the stimulus: the neuronal underpinnings of the Mach Band illusion (Mach, 1965). (B) One excitatory and one inhibitory neuron taken from the spatial model in panel A, now followed through an arbitrary period of time. Several response phases are predicted, including the onset- response, and the transient after-discharge (Adrian & Matthews, 1927). (C) A representation of the lateral inhibition model interactions within object space. The excitatory neurons in the center of the upper row receive excitatory input from a visual stimulus (for instance an object or group of objects with similar shapes). This excitation is transmitted laterally in the form of inhibition, resulting in “edge enhancement” across object space, equivalent to the retinotopic edge enhancement in earlier levels of the visual pathway (i.e. panel A). These interactions may lead to object-based visual masking illusions. Therefore low-level lateral inhibition may explain object substitution masking (OSM).
Figure 7.
Figure 7.
Overriding issues when considering the viability of feedback mechanisms. (A) A general model of early visual binocular integration without invoking feedback mechanisms. (B) If significant feedback existed between the initial dichoptic levels of processing and earlier monoptic levels, the earlier levels should behave in the same way as the dichoptic levels (i.e. they would become dichoptic by virtue of the feedback). Reprinted from Macknik (2006).
Figure 8.
Figure 8.
Psychophysical examination of dichoptic versus monoptic masking in humans. Human psychophysical measurements of visual masking when 10 ms duration target and 300 ms duration mask were presented to both eyes together (monoptic masking) and to the two eyes separately (dichoptic masking). The probability of discriminating correctly the length of two targets is diminished, in the average responses from 7 subjects, when targets were presented near the times of mask onset and termination. This is true regardless of whether the target and mask were presented to both eyes (open squares), or if the target was presented to one eye only and the mask was presented to the other (target = left, mask = right: closed upright triangles; target = right, mask = left: closed upside-down triangles). Open squares signify when the target was displayed with both shutters closed, showing that the stimuli were not visible through the shutters. When the mask and the target were presented simultaneously, both eyes’ shutters were necessarily open (dichoptic presentations using shutters are impossible when both stimuli are presented at the same time), and so between times 0-250 ms all four conditions were equivalent. Dichoptic masking is nevertheless evident when the target was presented before the mask’s onset (-250 to -50 ms on the abscissa), as well as when the target was presented after the mask had been terminated (300 ms to 500 ms on the abscissa). Reprinted from Macknik & Martinez-Conde (2004b).
Figure 9.
Figure 9.
Summary statistics of monoptic vs. dichoptic masking responses in the LGN and area V1. Monoptic (black bars) and dichoptic (white bars) masking magnitude as a function of cell type: LGN, V1 monocular, V1 binocular (non-responsive to dichoptic masking), and V1 binocular (responsive to dichoptic masking) neurons. Inset shows the linear regression of dichoptic masking magnitude in V1 binocular neurons as a function of their degree of binocularity (all neurons plotted were significantly binocular as measured by their relative responses to monocular targets presented to the two eyes sequentially): BI of 0 indicates that the cells were monocular, while a BI of 1 means both eyes were equally dominant. Reprinted from Macknik & Martinez- Conde (2004b).
Figure 10.
Figure 10.
Examples of retinotopy mapping from two subjects. (A & B) Visual areas delineated by retinotopic mapping analysis are indicated in different colors. Reprinted from Tse, et al. (2005).
Figure 11.
Figure 11.
Retinotopic analysis of monoptic versus dichoptic masking. (A) The logic underlying the analysis of masking magnitude for hypothetical retinotopic areas. The Mask Only response is bigger than the Target Only response because masks subtend a larger retinotopic angle than targets, and are moreover presented twice in each cycle for 100 msec each flash, whereas the target is single-flashed for only 50 msec. If the target response adds to the mask response in the Standing Wave of Invisibility condition (SWI, see Figure 16) (because no masking percept was experienced), then the SWI response will be bigger than the Mask Only response. If the target does not add (masking percept), then the SWI response will be equal or smaller than the Mask Only response (as the mask itself may also be somewhat reciprocally inhibited by the target). (B) Monoptic and dichoptic masking magnitude (% BOLD difference of Mask Only / SWI conditions) as a function of occipital retinotopic brain area, following the analysis described in panel A. Negative values indicate increased activation to the SWI condition (no masking), whereas values ≥ 0 indicate unchanged or decreased SWI activation (masking). (C) Dichoptic masking magnitude (% BOLD difference of Mask Only / SWI conditions) as a function of occipital retinotopic brain area within the dorsal and ventral processing streams. The strength of dichoptic masking builds up throughout the visual hierarchy for both the dorsal (R2 = 0.90) and ventral (R2 = 0.72) processing streams. Reprinted from Tse, et al. (2005).
Figure 12.
Figure 12.
Localization of visibility-correlated responses to the occipital lobe. (A) An individual brain model from all perspectives, including both hemispheres flat-mapped, overlaid with the functional activation from 17 subjects. The green shaded areas are those portions of the brain that did not show significant activation to Target Only stimuli. The blue voxels exhibited significant target activation (Target Only activation > Mask Only activation). Yellow voxels represent a significant difference between Control (target and mask both presented, with target-visible) and SWI (target and mask both presented, with target-invisible) conditions, indicating potentially effective visual masking, and thus a correlation with perceived visibility. (B) Response time-course plots from Control versus SWI conditions in the occipital cortex. (C) Response time-course plots from Control versus SWI conditions in non-occipital cortex. (D) Response time-course plots from the non-illusory conditions (Target Only and Mask Only combined) in occipital versus non-occipital cortex. This analysis controls for the possibility that occipital visual circuits have a higher degree of blood flow than non-occipital circuits. On the contrary, occipital BOLD signal to non-illusory stimuli is relatively low, as compared to non-occipital BOLD signal. Error bars in panels B, C, and D represent SEM between subjects. Reprinted from Tse, et al. (2005).
Figure 13.
Figure 13.
Layout of retinotopic areas that potentially maintain awareness of simple targets. An individual brain model from all perspectives, including both hemispheres flat-mapped, overlaid with the functional activation from one typical subject. The yellow shaded areas are those portions of the brain that did not show significant dichoptic masking (as in Figure 11B & 11C), and thus are ruled out for maintaining visual awareness of simple targets. The pink colored voxels represent the cortical areas that exhibited significant dichoptic masking, and thus are potential candidates for maintaining awareness of simple targets. Reprinted from Tse, et al. (2005).
Figure 14.
Figure 14.
Psychophysical length-discrimination measurements of visual masking from 23 human subjects using overlapping opaque masks of varied size (the distance from the mask’s edge to the target’s edge was 0°, 0.5°, 1°, 2°, or 4° as indicated in the insert). The subject’s task was to fixate on the central black dot and choose the longer target (right or left). Targets were black bars presented for 30 milliseconds; masks were also black and presented for 50 milliseconds. Targets turned on at time 0 ms, and masks were presented at various onset asynchronies so that they came on before, simultaneous to, or after the target in 20 ms steps. Stimulus onset asynchronies (SOAs) to the left of zero indicate forward masking conditions and SOAs greater than zero indicate backward masking. Miniature gray markers with dotted connecting lines represent conditions during which the target and mask overlapped in time and so the target was partially or completely occluded by the mask. The targets were 0.5° wide and had varied heights (5.5°, 5.0°, or 4.5°) and were placed 3° from the fixation dot. The mask was a bar 6° tall with varied widths, spatially overlapped and centered over each target. There were 540 conditions (2 possible choices X 2 differently sized target sets to foil local cue discrimination strategies X 5 overlapping mask sizes X 27 stimulus onset asynchronies). Each condition was presented in random order 5 times to each subject, over a period of 2 days, for a total of 62,100 trials (summed over all 23 subjects). Reprinted from Macknik, et al. (2000).
Figure 15.
Figure 15.
Human psychophysical length-discrimination measurements of visual masking effects from 11 human subjects using non-overlapping masks of varied duration (100, 300, or 500 ms). SOA here represents the period of time between the onset of the mask and the onset of the target (and so it has the opposite meaning than in Figures 3, 4 and 14). Masks (two 6° tall bars with a width of 0.5° flanking each side of each target) appeared at time 0, and targets could appear earlier (backward masking), simultaneously, or later (forward masking), in 50 ms steps. Targets were black and presented for 10 ms duration and masks were flanking black bars that abutted the target. Notice that target visibility is most greatly affected when the masks turn on and off. Reprinted from Macknik, et al. (2000).
Figure 16.
Figure 16.
The time-course of events during the Standing Wave of Invisibility illusion (SWI). A flickering target (a bar) of 50 ms duration is preceded and succeeded by two counter-phase flickering masks (two bars that abut and flank the target, but do not overlap it) of 100 ms duration that are presented at the time optimal to both forward and backward mask the target. Reprinted from Macknik (2006).

Similar articles

Cited by

References

    1. Adrian E. D., Matthews R. The action of light on the eye. Part I. The discharge of impulses in the optic nerve and its relation to the electric changes in the retina. Journal of Physiology. 1927;63:378–414. - PMC - PubMed
    1. Albrecht D. G., Hamilton D. B. Striate cortex of monkey and cat: contrast response function. Journal of Neurophysiology. 1982;48:217–237. - PubMed
    1. Allman J., Miezin F., McGuinness E. Stimulus specific responses from beyond the classical receptive field: Neurophysiological mechanisms for local-global comparisons in visual neurons. Annual Review of Neuroscience. 1985;8:407–430. - PubMed
    1. Angelucci A., Bressloff P. C. Contribution of feedforward, lateral and feedback connections to the classical receptive field center and extra-classical receptive field surround of primate V1 neurons. Progress in Brain Research. 2006;154:93–120. - PubMed
    1. Angelucci A., Levitt J. B., Lund J. S. Anatomical origins of the classical receptive field and modulatory surround field of single neurons in macaque visual cortical area V1. Progress in Brain Research. 2002;136:373–388. - PubMed

LinkOut - more resources