. 2010 Jun;67(6):749-60.
doi: 10.1002/ana.22005.

Longitudinal study of vision and retinal nerve fiber layer thickness in multiple sclerosis

Affiliations

Longitudinal study of vision and retinal nerve fiber layer thickness in multiple sclerosis

Lauren S Talman et al. Ann Neurol. 2010 Jun.

Abstract

Objective: Cross-sectional studies of optical coherence tomography (OCT) show that retinal nerve fiber layer (RNFL) thickness is reduced in multiple sclerosis (MS) and correlates with visual function. We determined how longitudinal changes in RNFL thickness relate to visual loss. We also examined patterns of RNFL thinning over time in MS eyes with and without a prior history of acute optic neuritis (ON).

Methods: Patients underwent OCT measurement of RNFL thickness at baseline and at 6-month intervals during a mean follow-up of 18 months at 3 centers. Low-contrast letter acuity (2.5%, 1.25% contrast) and visual acuity (VA) were assessed.

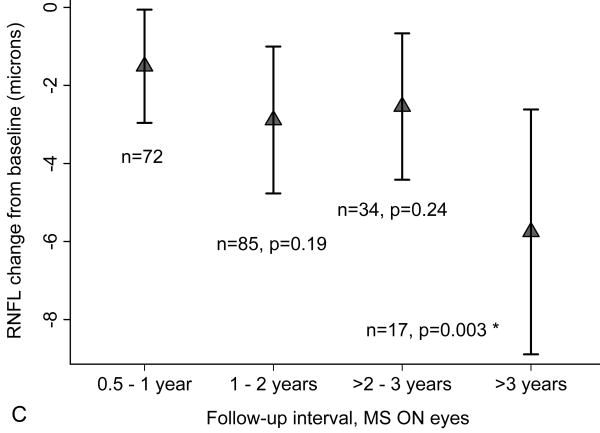
Results: Among 299 patients (593 eyes) with >or=6 months follow-up, eyes with visual loss showed greater RNFL thinning compared to eyes with stable vision (low-contrast acuity, 2.5%: p < 0.001; VA: p = 0.005). RNFL thinning increased over time, with average losses of 2.9microm at 2 to 3 years and 6.1microm at 3 to 4.5 years (p < 0.001 vs 0.5-1-year follow-up interval). These patterns were observed for eyes with or without prior history of ON. Proportions of eyes with RNFL loss greater than test-retest variability (>or=6.6microm) increased from 11% at 0 to 1 year to 44% at 3 to 4.5 years (p < 0.001).

Interpretation: Progressive RNFL thinning occurs as a function of time in some patients with MS, even in the absence of ON, and is associated with clinically significant visual loss. These findings are consistent with subclinical axonal loss in the anterior visual pathway in MS, and support the use of OCT and low-contrast acuity as methods to evaluate the effectiveness of putative neuroprotection protocols.


Figures

Fig 1
Fig 1
Bar graphs showing mean changes from baseline in retinal nerve fiber layer (RNFL) thickness by optical coherence tomography (OCT) for multiple sclerosis (MS) eyes with and without visual loss. The bars represent mean changes in RNFL thickness from baseline and the vertical lines are 95% confidence intervals. Data are presented for MS eyes with no vision loss (left bars), MS eyes with loss of vision (middle bars), and all MS eyes based on (A) high-contrast visual acuity (VA), Early Treatment Diabetic Retinopathy (ETDRS) charts; (B) low-contrast letter acuity, 2.5% contrast level, low-contrast Sloan letter charts; and (C) low-contrast letter acuity, 1.25% contrast level. Definitions of visual loss were based on degrees of change in score that are beyond those expected for test-retest variability (5 letters for visual acuity, 7 letters for low-contrast acuity); these values are based on literature for the two vision testing methods.,, Reductions in average RNFL thickness were greater for eyes with visual loss for VA and for low-contrast acuity at the 2.5% contrast level. * Logistic regression models, accounting for age and adjusting for within-patient, inter-eye correlations, were used to determine the association between visual loss and degree of RNFL thinning from baseline.
Fig 1
Fig 1
Bar graphs showing mean changes from baseline in retinal nerve fiber layer (RNFL) thickness by optical coherence tomography (OCT) for multiple sclerosis (MS) eyes with and without visual loss. The bars represent mean changes in RNFL thickness from baseline and the vertical lines are 95% confidence intervals. Data are presented for MS eyes with no vision loss (left bars), MS eyes with loss of vision (middle bars), and all MS eyes based on (A) high-contrast visual acuity (VA), Early Treatment Diabetic Retinopathy (ETDRS) charts; (B) low-contrast letter acuity, 2.5% contrast level, low-contrast Sloan letter charts; and (C) low-contrast letter acuity, 1.25% contrast level. Definitions of visual loss were based on degrees of change in score that are beyond those expected for test-retest variability (5 letters for visual acuity, 7 letters for low-contrast acuity); these values are based on literature for the two vision testing methods.,, Reductions in average RNFL thickness were greater for eyes with visual loss for VA and for low-contrast acuity at the 2.5% contrast level. * Logistic regression models, accounting for age and adjusting for within-patient, inter-eye correlations, were used to determine the association between visual loss and degree of RNFL thinning from baseline.
Fig 2
Fig 2
Graphs showing mean changes from baseline in retinal nerve fiber layer (RNFL) thickness by length of follow-up for multiple sclerosis (MS) eyes. The triangles represent point estimates for mean changes in RNFL thickness from baseline for each follow-up interval. The vertical lines are 95% confidence intervals. (A) Among all MS eyes in the follow-up cohort, n=593, degrees of RNFL thinning increased with increasing follow-up from baseline. Each eye is represented only once in panel (A), with the follow-up interval based on the most recent post-baseline study visit. (B) MS eyes without a past history of acute optic neuritis (ON, n=381) showed strikingly similar patterns of RNFL thinning with increasing follow-up from baseline. (C) Eyes with an ON history (n=208) were fewer, yet demonstrated a trend toward increasing degrees of RNFL thinning over time; these eyes also had lower values for RNFL at baseline. History of ON could not be determine for 4 eyes in the follow-up cohort; thus n=589 for the ON + non-ON eyes in (B) and (C). * Generalized estimating equation (GEE) models, accounting for age and adjusting for within-patient, inter-eye correlations were used for analyses; p-values are based on comparisons of RNFL thinning at the >1-year follow-up intervals to 0.5-1-year follow-up interval.
Fig 2
Fig 2
Graphs showing mean changes from baseline in retinal nerve fiber layer (RNFL) thickness by length of follow-up for multiple sclerosis (MS) eyes. The triangles represent point estimates for mean changes in RNFL thickness from baseline for each follow-up interval. The vertical lines are 95% confidence intervals. (A) Among all MS eyes in the follow-up cohort, n=593, degrees of RNFL thinning increased with increasing follow-up from baseline. Each eye is represented only once in panel (A), with the follow-up interval based on the most recent post-baseline study visit. (B) MS eyes without a past history of acute optic neuritis (ON, n=381) showed strikingly similar patterns of RNFL thinning with increasing follow-up from baseline. (C) Eyes with an ON history (n=208) were fewer, yet demonstrated a trend toward increasing degrees of RNFL thinning over time; these eyes also had lower values for RNFL at baseline. History of ON could not be determine for 4 eyes in the follow-up cohort; thus n=589 for the ON + non-ON eyes in (B) and (C). * Generalized estimating equation (GEE) models, accounting for age and adjusting for within-patient, inter-eye correlations were used for analyses; p-values are based on comparisons of RNFL thinning at the >1-year follow-up intervals to 0.5-1-year follow-up interval.
Fig 3
Fig 3
Scatter plot and fitted linear regression line showing the relation for between RNFL thinning from baseline and follow-up time from baseline to the last visit as a continuous variable in years. The regression line represents fitted values for mean RNFL thinning from baseline for the latest follow-up visit for MS eyes; the gray shaded area shows the 95% confidence intervals on the mean values. The scatter plot and regression line represent group data for degree of RNFL thinning observed between baseline and the last follow-up visit, and are not meant to define patterns of RNFL thinning over time for individual eyes; the pattern of RNFL thinning in individual eyes may not, in fact, be linear throughout the course of follow-up. This graph also illustrates that there are very few outliers with respect to RNFL thinning. Accounting for age and adjusting for within-patient, inter-eye correlations, the relation between RNFL thinning from baseline and follow-up time at the last visit as a continuous variable was significant (p<0.001, GEE models). For the cohort and length of time examined (range 0.5 to 4.5 years), each 1 year of follow-up was associated, on average, with 2.0 μm increases in the amount of RNFL thinning.

References

    1. Mowry EM, Loguidice MJ, Daniels AB, et al. Vision related quality of life in multiple sclerosis: correlation with new measures of low and high contrast letter acuity. J Neurol Neurosurg Psychiatry. 2009;80:767–772. - PubMed
    1. Trapp BD, Peterson J, Ransohoff RM, et al. Axonal transection in the lesions of multiple sclerosis. N Engl J Med. 1998;338:278–285. - PubMed
    1. Evangelou N, Konz D, Esiri MM, et al. Size-selective neuronal changes in the anterior optic pathways suggest a differential susceptibility to injury in multiple sclerosis. Brain. 2001;124:1813–1820. - PubMed
    1. DeLuca GC, Williams K, Evangelou N, et al. The contribution of demyelination to axonal loss in multiple sclerosis. Brain. 2006;129:1507–1516. - PubMed
    1. Sepulcre J, Goñi J, Masdeu JC, et al. Contribution of white matter lesions to gray matter atrophy in multiple sclerosis: evidence from voxel-based analysis of T1 lesions in the visual pathway. Arch Neurol. 2009;66:173–179. - PubMed

Publication types

LinkOut - more resources