. 2010 Jun:Chapter 7:Unit 7.13.
doi: 10.1002/0471142700.nc0713s41.

Diffraction techniques in structural biology

Affiliations

Diffraction techniques in structural biology

Martin Egli. Curr Protoc Nucleic Acid Chem. 2010 Jun.

Abstract

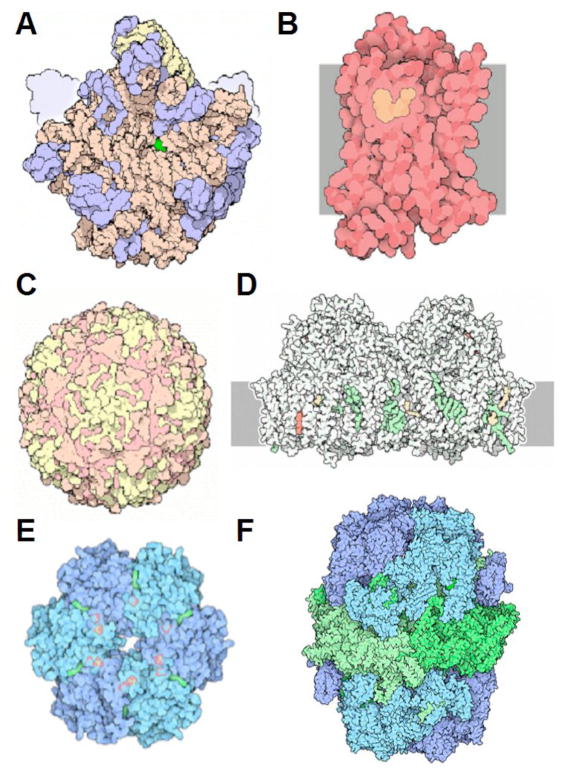
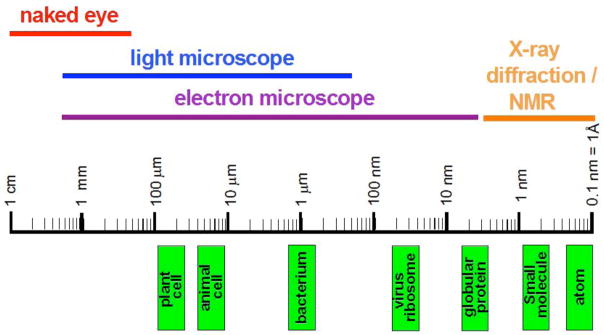
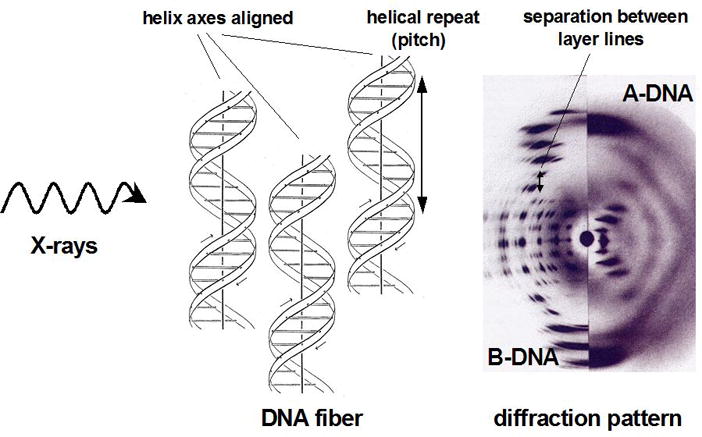
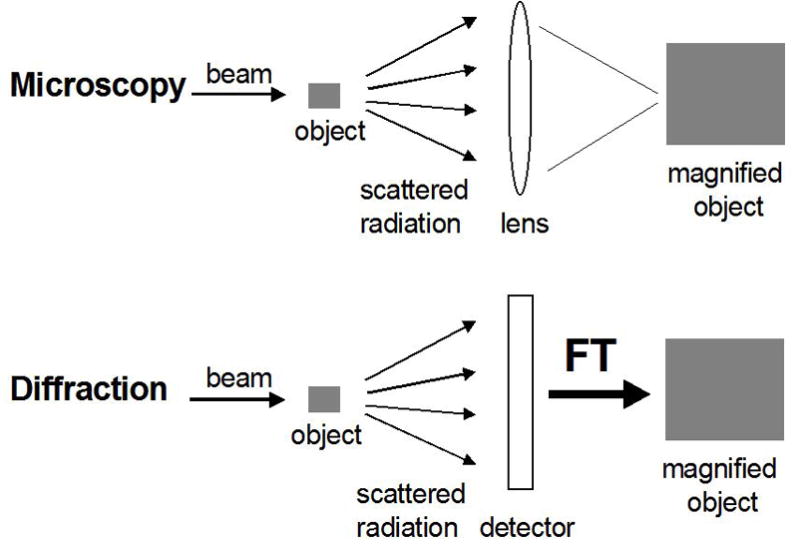
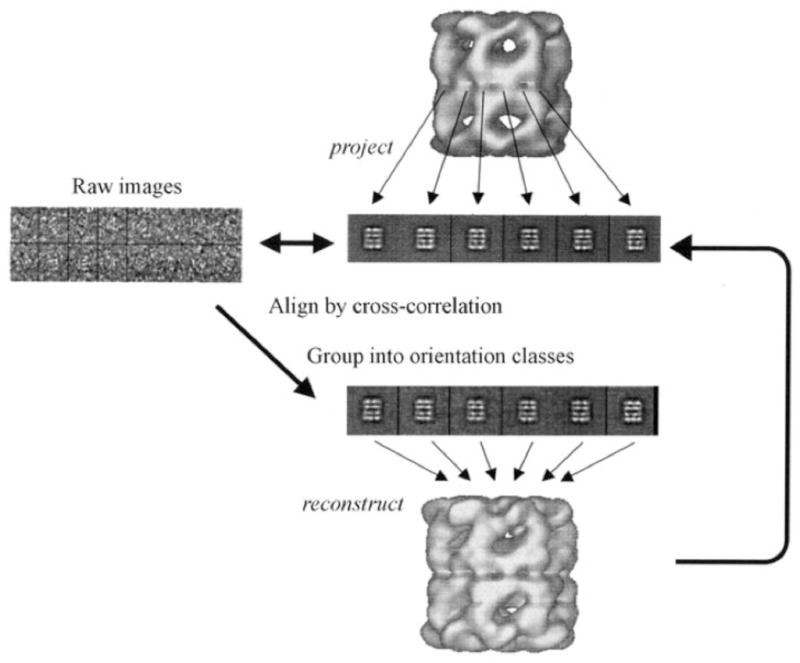
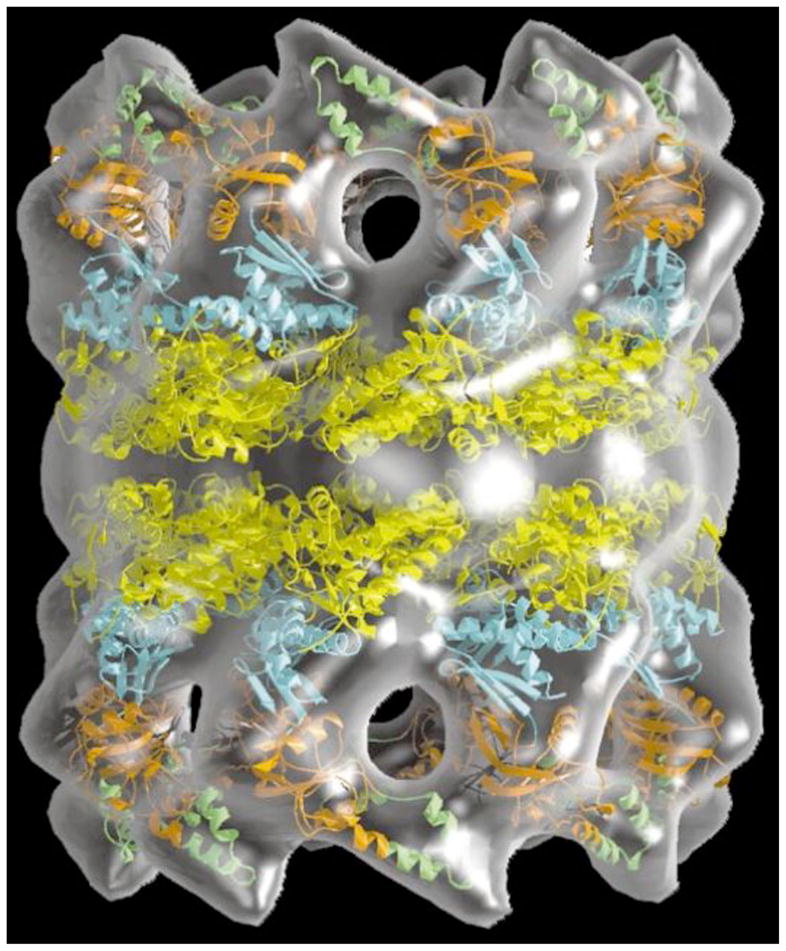
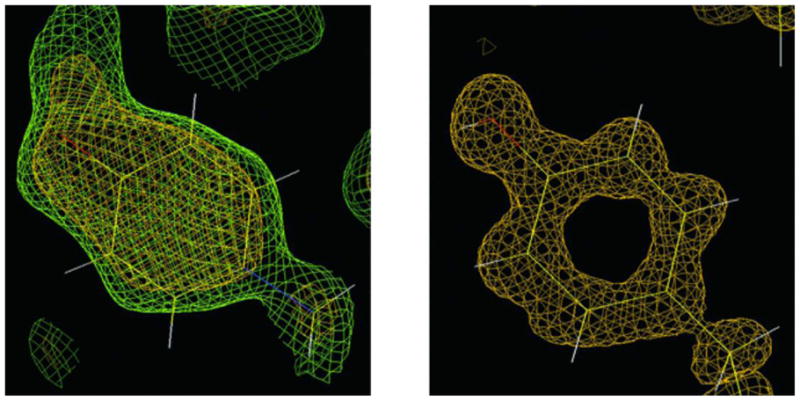
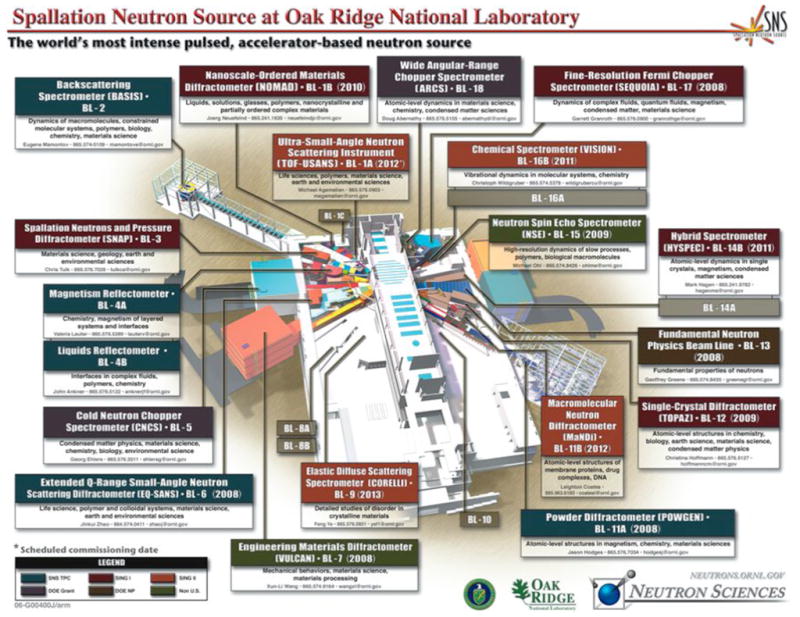
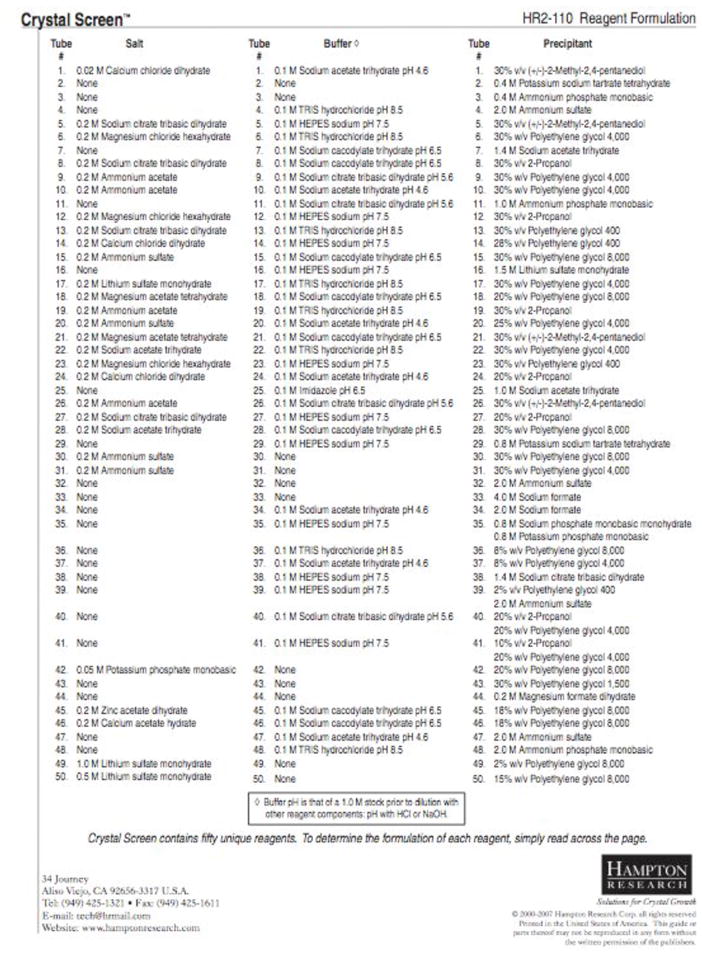
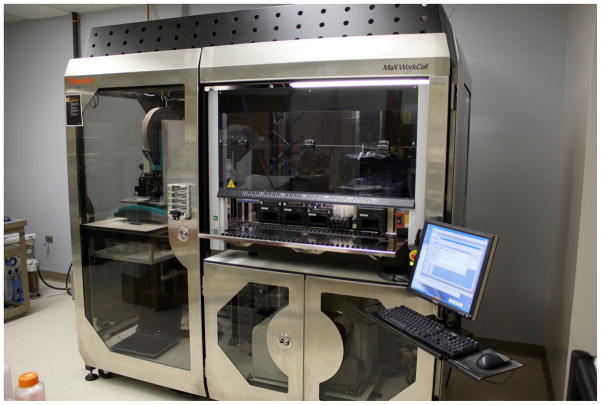
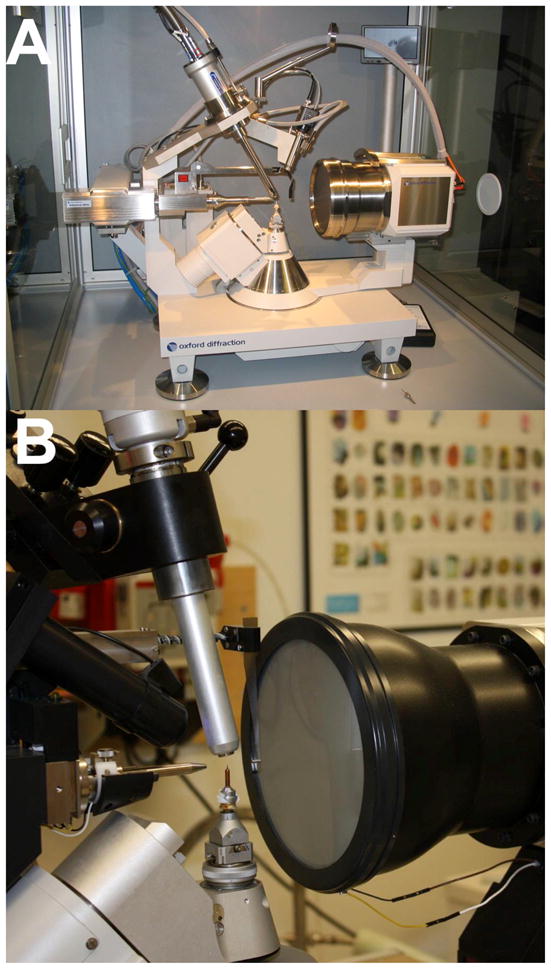
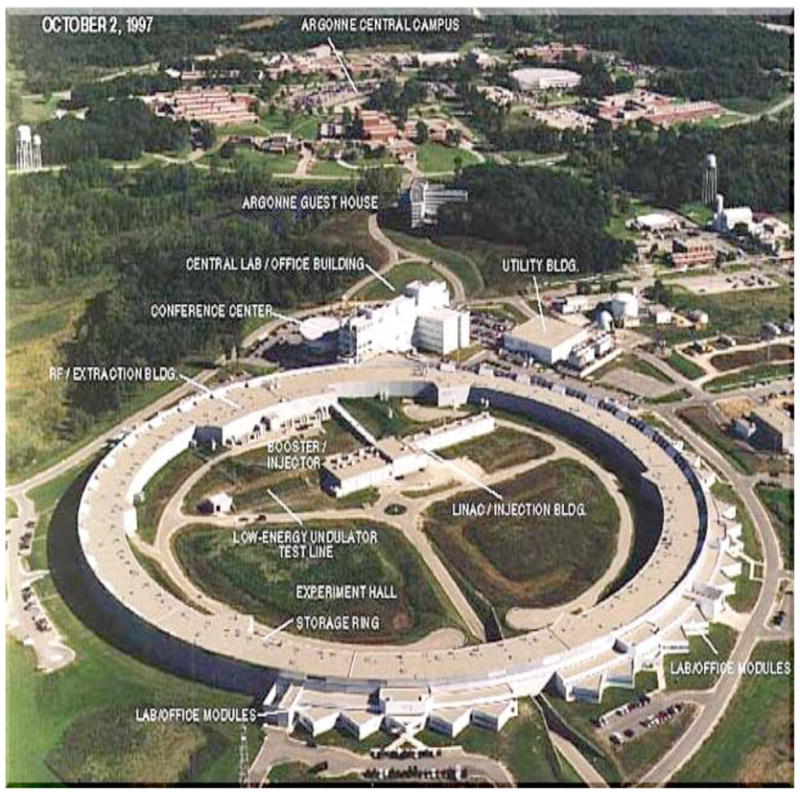
A detailed understanding of chemical and biological function and the mechanisms underlying the molecular activities ultimately requires atomic-resolution structural data. Diffraction-based techniques such as single-crystal X-ray crystallography, electron microscopy, and neutron diffraction are well established and they have paved the road to the stunning successes of modern-day structural biology. The major advances achieved in the last 20 years in all aspects of structural research, including sample preparation, crystallization, the construction of synchrotron and spallation sources, phasing approaches, and high-speed computing and visualization, now provide specialists and nonspecialists alike with a steady flow of molecular images of unprecedented detail. The present unit combines a general overview of diffraction methods with a detailed description of the process of a single-crystal X-ray structure determination experiment, from chemical synthesis or expression to phasing and refinement, analysis, and quality control. For novices it may serve as a stepping-stone to more in-depth treatises of the individual topics. Readers relying on structural information for interpreting functional data may find it a useful consumer guide.


Figures

Figure 1
Figure 1
Recent Triumphs of Structural Biology. (A) The ribosome (large subunit; PDB entry code 1ffk); (B) Adrenergic receptor (GPCR; PDB entry code 2rh1); (C) Poliovirus (PDB entry code 2plv); (D) Photosystem II (PDB entry code 1s5l); (E) Cyanobacterial master clock protein KaiC (PDB entry code 2gbl); (F) Fatty acid synthase (PDB entry codes 2uvb and 2uvc). Reprinted with permission from David S. Goodsell, RCSB/PDB (http://www.rcsb.org/pdb/static.do?p=education_discussion/molecule_of_the_month/index.html; Molecule of the Month Illustrations; info@rcsb.org).
Figure 2
Figure 2
From the Visible to the Invisible. The diagram depicts the rough sizes of cells and their components on a logarithmic scale and illustrates the range of objects that can be visualized with different techniques.
Figure 3
Figure 3
Principles of Fiber Diffraction. The diffraction pattern resulting from aligned helical structures in fibers exposed to X-rays exhibit characteristic cross-like shapes. The drawing of the DNA duplex was originally created by Odile Crick and is adapted from (Kemp, 2003).
Figure 4
Figure 4
Light Microscopy versus Diffraction. Structure determination by X-ray diffraction entails the use of a mathematical lens, Fourier Transformation (FT), to ‘focus’ the scattered radiation.
Figure 5
Figure 5
Light microscopy versus electron microscopy. Lenses allow reconstruction of the image in both techniques, but to focus electron beams electromagnetic lenses are required. Standard light microscope (LM, left), transmission electron microscope (TEM, center), and scanning electron microscope (SEM, right). Source: http://www.vcbio.science.ru.nl/images/fesem beam zoom.jpg. Original illustration: Jeol Instruments. Redrawn by vcbio.science.ru.nl, Radboud University Nijmegen. Used with permission.
Figure 6
Figure 6
Example of an SEM image. The star-shaped structure in a mature extracellular Acanthamoeba polyphaga mimivirus, an icosahedral double-stranded DNA virus. The scale bar measures 200 nm. Reproduced from Zauberman et al. (2008).
Figure 7
Figure 7
Negative-Stain and Cryo-EM. Left: A virus particle is outlined with good contrast by heavy-metal stain but is somewhat flattened due to dehydration. Right: By comparison it is preserved in the native state in the cryo-EM sample, but the protein-ice contrast is very low. The particle is therefore imaged over holes in the carbon support to maximize the contrast. Reprinted with permission from (Saibil, 2000).
Figure 8
Figure 8
Single-Particle EM 3D-Reconstruction from 2D-Projections. A set of 2D-projections (four in this case) is depicted along rendered iso-surfaces. The Fourier transform of a 2D-projection is equivalent to a central section in the 3D-FT of a molecule. Once a sufficient number of sections are available, the complete 3D-transform can be generated and inverse-transformed into a 3D-density map (bottom). Reprinted with permission from (Saibil, 2000).
Figure 9
Figure 9
Refinement by Projection Matching. Reference images are created by projecting a 3D-map into a set of different orientations (center). Each raw image from the data set (left) is then rotationally and translationally aligned to individual reference images and given the orientation with the highest correlation coefficient. Images aligned in this fashion are grouped and averaged once again to create an improved 3D-map (bottom). Reprinted with permission from (Saibil, 2000).
Figure 10
Figure 10
3D-Model of the Archaeal Thermosome Holoenzyme. Crystal structures of the subunits (in color) are modeled into the EM-molecular envelope of the hexadecameric chaperone. Reprinted with permission from (Baumeister and Steven, 2000).
Figure 11
Figure 11
Neutron versus X-ray Macromolecular Crystallography. Left: The neutron density for Tyr137 in the structure of D-xylose isomerase contoured at 1.5σ(green) and 2.0σ(yellow) clearly reveals the orientation of the deuteron on the O atom of tyrosine. Right: The protonation state of Tyr254 remains unclear from electron density maps in the X-ray crystal structure of the same enzyme determined to 0.94-Å resolution at −170°C. Reprinted with permission from (Hanson et al., 2004).
Figure 12
Figure 12
The Spallation Neutron Source (SNS) at Oak Ridge National Laboratory (ORNL, Oak Ridge, Tennessee, USA). The SNS instrument hall currently under construction will eventually contain 24 instruments on 18 beam lines. The Macromolecular Neutron Diffractometer (MaNDi, BL-11B) and the Single-Crystal Diffractometer (TOPAZ, BL-12), to be completed in 2012 and 2009, respectively, are of particular interest for neutron macromolecular crystallography research. Source: http://neutrons.ornl.gov/instrument_systems/beamline.shtml; please visit the original website and click on the individual boxes for details of the instrument layout and capabilities.
Figure 13
Figure 13
One-Dimensional 1H-NMR Spectrum of Ethanol. The three groups of protons in this small molecule, (C)H3, (C)H2, and (O)H, all exhibit different chemical shifts relative to the protons in reference molecule, tetramethylsilane (TMS). The characteristic splitting of the signals arising from the methyl (1:2:1) and methylene (1:3:3:1) protons is the result of through-bond coupling between neighboring nuclei.
Figure 14
Figure 14
Two-Dimensional Heteronuclear NMR Spectroscopy. 15N-HSQC spectrum of the circadian clock protein KaiB from the cyanobacterium Synechococcus elongatus recorded on an 800 MHz spectrometer.
Figure 15
Figure 15
Individual Stages of a Macromolecular X-ray Crystal Structure Determination. Selected methods are highlighted on the right. Approaches for refining structures include least squares fitting and simulated annealing. Adapted from (Ringe and Petsko, 1996).
Figure 16
Figure 16
Two Related Methods for Growing Single Crystals of Biomacromolecules. Schematic depictions of the (A) hanging and (B) sitting drop vapor diffusion techniques. The volume of the droplets is in the nL (Nanodrop setting robots) to μL range.
Figure 17
Figure 17
Example of a Sparse Matrix Crystallization Screen. Composition of the 50 solutions in the so-called Crystal Screen that is commercially available from Hampton Research Inc. (Aliso Viejo, CA). R eprinted with permission from: http://hamptonresearch.com/product_detail.aspx?cid=1&sid=17&pid=1.
Figure 18
Figure 18
Automation of Crystallization Experiments. Crystallization robot in the laboratory of the author, the MaX WorkCell by Thermo Fisher Scientific Inc. The WorkCell integrates nanodrop setting (“Mosquito”, Molecular Dimensions Inc., Apopka, FL; on the left), liquid handling and screen preparation (“Starlet”, Hamilton Company, Reno, NV.; on the right), and sealing of crystallization plates (bottom right). The robot can handle a wide range of crystallization plates and formats and is typically combined with so-called storage hotels and a plate imager (not shown), that permit automated, periodic access to bar-coded plates and digital photography of individual droplets, respectively.
Figure 19
Figure 19
X-ray Generators and Detectors. Two 4-circle, kappa-geometry X-ray diffraction setups currently used by researchers at Vanderbilt University: (A) The sealed tube Oxford Xcalibur PX2 Ultra (Oxford Diffraction Inc., Blacksburg, VA), and (B) the rotating anode Bruker Microstar (Bruker AXS Inc., Madison, WI). Tube housing (Xcalibur), beam collimator, beam stop, CCD detector, crystal cooler, goniostat, goniometer head and telescope are clearly visible.
Figure 20
Figure 20
X-ray Synchrotron. Aerial view of the Advanced Photon Source (APS) at Argonne National Laboratory (Argonne, IL), a so-called 3rd generation X-ray synchrotron.
Figure 21
Figure 21
Inside a Synchrotron Experimental Station. The Marresearch Charge Coupled Device detector (MARCCD 225; foreground, http://www.marresearch.com/) mounted on the MAR Desktop Beamline® (DTB) at the Insertion Device beamline (5-ID-D hutch) of the DuPont-Northwestern-Dow Collaborative Access Team (DND-CAT), located at sector 5 of the APS (Argonne, IL). The view is into the beam that is transported along the tube visible in the center of the upper half of the photograph. The instrumentation colored light blue in the background is not part of the macromolecular crystallography setup. Work conducted at the DND-CAT now focuses more on surface and interface science, nano-materials, catalysis and environmental science. The macromolecular crystallography efforts have moved to the new Life Sciences (LS-CAT) at sector 21 of the APS that offers four ID lines and is jointly run by Michigan institutions, Northwestern University, the University of Illinois at Urbana-Champaign, the University of Wisconsin and Vanderbilt University. Further consortia that operate ID and/or Bending Magnet (BM) beamlines for macromolecular crystallography at the APS include BioCARS-CAT (sector 14), IMCA-CAT (sector 17), SBC-CAT (sector 19), SER-CAT (sector 22), GM/CA-CAT (sector 23) and NE-CAT (sector 24).
Figure 22
Figure 22
Diffraction Data Collection. Close-up of a 1-degree (ΔPhi) diffraction image obtained from a single crystal of the so-called Dickerson Drew Dodecamer (DDD; B-form DNA of sequence CGCGAATTCGCG). The dark spots represent individual reflections and the diffraction limit is around 1 Å. Data statistics for this particular crystal of the DDD are listed in Table 5.
Figure 23
Figure 23
Multiwavelength Anomalous Dispersion (MAD) Experiment. Example of an X-ray fluorescence spectrum from a protein crystal that contains Se-methionine (Se-Met) in place of Met (Maf protein from Bacillus subtilis; 189 amino acids and 6 Se atoms per protein molecule). The theoretical K absorption edge of selenium lies at 12.6578 keV or 0.9795 Å (an energy of 12.398 keV corresponds to 1.0 Å; http://skuld.bmsc.washington.edu/scatter/). In a typical MAD experiment, diffraction data of high redundancy from the same crystal are collected at three or four wavelengths (i.e. reference below the edge, low, inflection point, inf., peak, max, and reference above the edge, high).
Figure 24
Figure 24
MAD Phasing. Experimental electron density map based on five Se sites obtained from a Se-Met crystal of the Maf protein (2.7 Å resolution, no solvent flattening), calculated with the program SOLVE (Terwilliger and Berendzen, 1999). The map displays clear boundaries and reveals large solvent-filled channels (black regions).
Figure 25
Figure 25
Resolution and Quality of the Electron Density. Comparison of the quality of the Fourier (2Fo-Fc) sum electron density around adenosine monophosphate in crystal structures obtained at various resolutions (1σ threshold): (A) 2.85 Å, ATP in the crystal structure of the KaiC protein from Synechococcus elongatus; (B) 1.80 Å, A residue in the crystal structure of a B-form DNA; (C) 1.10 Å, atomic resolution, A residue in the crystal structure of an A-form DNA.
Figure 26
Figure 26
Structure Refinement and Quality Control. Conformations of the Φ and Ψ backbone torsion angle pairs (Ramachandran plot) for amino acids in the crystal structure of the KaiC clock protein from S. elongatus (PDD ID code 2GBL) (CCP4, 1994). Individual angles fall into the most favored regions (A, B, L; red [84%]), additionally allowed regions (a, b, l, p; yellow [13.3%]), generously allowed regions (~a, ~b, ~l, ~p; faint yellow [1.8%]), or disallowed regions (white [1%]). There are 244 glycine (shown as triangles) and 74 proline residues.

Similar articles

Cited by

References

    1. Abola E, Kuhn P, Earnest T, Stevens RC. Automation of X-ray crystallography. Nat Struct Biol. 2000;7(suppl):973–977. - PubMed
    1. Baeyens KJ, Jancarik J, Holbrook SR. Use of low-molecular-weight polyethylene glycol in the crystallization of RNA oligomers. Acta Cryst D. 1994;50:764–767. - PubMed
    1. Baumeister W, Steven AC. Macromolecular electron microscopy in the era of structural genomics. Trends Biochem Sci. 2000;25:624–631. - PubMed
    1. Berger I, Kang CH, Sinha N, Wolters M, Rich A. A highly efficient 24-condition matrix for the crystallization of nucleic acid fragments. Acta Cryst D. 1996;52:465–468. - PubMed
    1. Berman HM, Olson WK, Beveridge DL, Westbrook J, Gelbin A, Demeny T, Hsieh S-H, Srinivasan AR, Schneider B. The nucleic acid database: a comprehensive relational database of three-dimensional structures of nucleic acids. Biophys J. 1992;63:751–759. On the web: http://ndbserver.rutgers.edu. - PMC - PubMed

Publication types

LinkOut - more resources