

Site-specific incorporation of 3-nitrotyrosine as a probe of pKa perturbation of redox-active tyrosines in ribonucleotide reductase
- PMID: 20518462
- PMCID: PMC2905227
- DOI: 10.1021/ja101097p
Site-specific incorporation of 3-nitrotyrosine as a probe of pKa perturbation of redox-active tyrosines in ribonucleotide reductase
Abstract
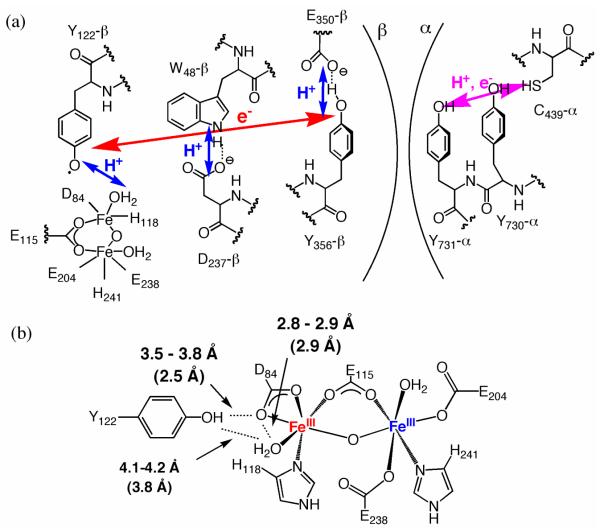
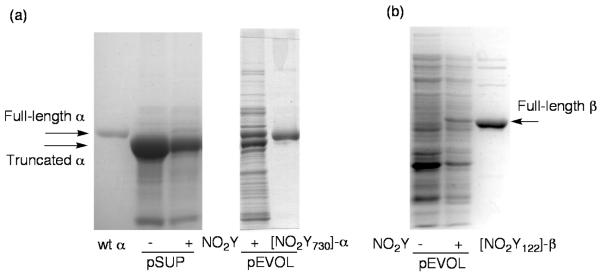
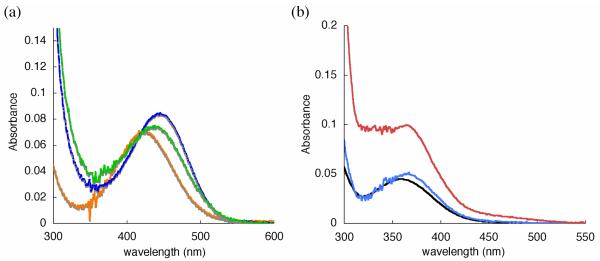
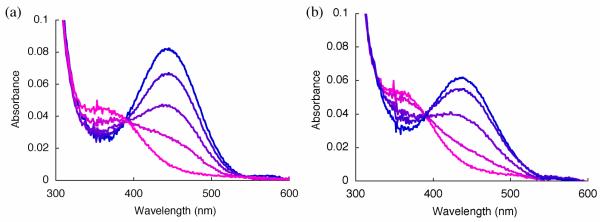
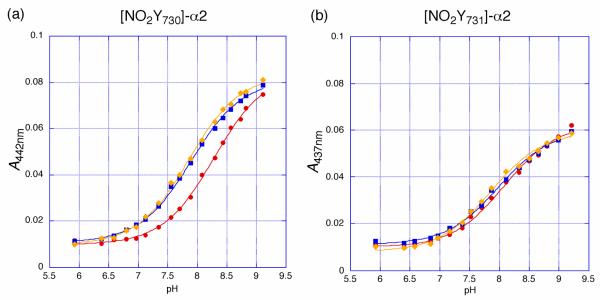
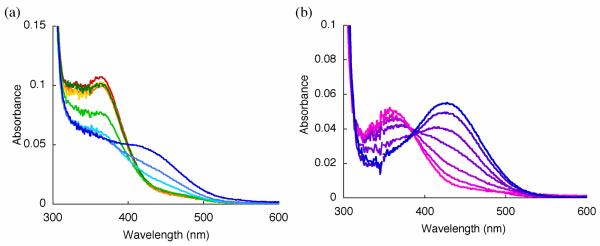
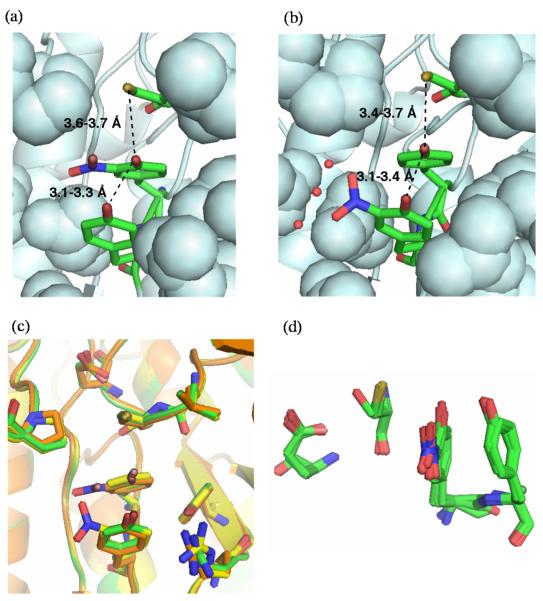
E. coli ribonucleotide reductase catalyzes the reduction of nucleoside 5'-diphosphates into 2'-deoxynucleotides and is composed of two subunits: alpha2 and beta2. During turnover, a stable tyrosyl radical (Y*) at Y(122)-beta2 reversibly oxidizes C(439) in the active site of alpha2. This radical propagation step is proposed to occur over 35 A, to use specific redox-active tyrosines (Y(122) and Y(356) in beta2, Y(731) and Y(730) in alpha2), and to involve proton-coupled electron transfer (PCET). 3-Nitrotyrosine (NO(2)Y, pK(a) 7.1) has been incorporated in place of Y(122), Y(731), and Y(730) to probe how the protein environment perturbs each pK(a) in the presence of the second subunit, substrate (S), and allosteric effector (E). The activity of each mutant is <4 x 10(-3) that of the wild-type (wt) subunit. The [NO(2)Y(730)]-alpha2 and [NO(2)Y(731)]-alpha2 each exhibit a pK(a) of 7.8-8.0 with E and E/beta2. The pK(a) of [NO(2)Y(730)]-alpha2 is elevated to 8.2-8.3 in the S/E/beta2 complex, whereas no further perturbation is observed for [NO(2)Y(731)]-alpha2. Mutations in pathway residues adjacent to the NO(2)Y that disrupt H-bonding minimally perturb its pK(a). The pK(a) of NO(2)Y(122)-beta2 alone or with alpha2/S/E is >9.6. X-ray crystal structures have been obtained for all [NO(2)Y]-alpha2 mutants (2.1-3.1 A resolution), which show minimal structural perturbation compared to wt-alpha2. Together with the pK(a) of the previously reported NO(2)Y(356)-beta2 (7.5 in the alpha2/S/E complex; Yee, C. et al. Biochemistry 2003, 42, 14541-14552), these studies provide a picture of the protein environment of the ground state at each Y in the PCET pathway, and are the starting point for understanding differences in PCET mechanisms at each residue in the pathway.
Figures
Similar articles
-
Use of 2,3,5-F(3)Y-β2 and 3-NH(2)Y-α2 to study proton-coupled electron transfer in Escherichia coli ribonucleotide reductase.Biochemistry. 2011 Mar 1;50(8):1403-11. doi: 10.1021/bi101319v. Epub 2011 Feb 8. Biochemistry. 2011. PMID: 21182280 Free PMC article.
-
Reversible, long-range radical transfer in E. coli class Ia ribonucleotide reductase.Acc Chem Res. 2013 Nov 19;46(11):2524-35. doi: 10.1021/ar4000407. Epub 2013 Jun 4. Acc Chem Res. 2013. PMID: 23730940 Free PMC article.
-
Kinetics of radical intermediate formation and deoxynucleotide production in 3-aminotyrosine-substituted Escherichia coli ribonucleotide reductases.J Am Chem Soc. 2011 Jun 22;133(24):9430-40. doi: 10.1021/ja201640n. Epub 2011 May 25. J Am Chem Soc. 2011. PMID: 21612216 Free PMC article.
-
Reaction dynamics and proton coupled electron transfer: studies of tyrosine-based charge transfer in natural and biomimetic systems.Biochim Biophys Acta. 2015 Jan;1847(1):46-54. doi: 10.1016/j.bbabio.2014.09.003. Epub 2014 Sep 28. Biochim Biophys Acta. 2015. PMID: 25260243 Review.
-
Long-range proton-coupled electron transfer in the Escherichia coli class Ia ribonucleotide reductase.Essays Biochem. 2017 May 9;61(2):281-292. doi: 10.1042/EBC20160072. Print 2017 May 9. Essays Biochem. 2017. PMID: 28487404 Review.
Cited by
-
Biophysical Characterization of Fluorotyrosine Probes Site-Specifically Incorporated into Enzymes: E. coli Ribonucleotide Reductase As an Example.J Am Chem Soc. 2016 Jun 29;138(25):7951-64. doi: 10.1021/jacs.6b03605. Epub 2016 Jun 21. J Am Chem Soc. 2016. PMID: 27276098 Free PMC article.
-
Electron hopping through proteins.Coord Chem Rev. 2012 Nov 1;256(21-22):2478-2487. doi: 10.1016/j.ccr.2012.03.032. Epub 2012 Apr 5. Coord Chem Rev. 2012. PMID: 23420049 Free PMC article.
-
Use of 2,3,5-F(3)Y-β2 and 3-NH(2)Y-α2 to study proton-coupled electron transfer in Escherichia coli ribonucleotide reductase.Biochemistry. 2011 Mar 1;50(8):1403-11. doi: 10.1021/bi101319v. Epub 2011 Feb 8. Biochemistry. 2011. PMID: 21182280 Free PMC article.
-
Reversible, long-range radical transfer in E. coli class Ia ribonucleotide reductase.Acc Chem Res. 2013 Nov 19;46(11):2524-35. doi: 10.1021/ar4000407. Epub 2013 Jun 4. Acc Chem Res. 2013. PMID: 23730940 Free PMC article.
-
Mimicking Nonribosomal Peptides from the Marine Actinomycete Streptomyces sp. H-KF8 Leads to Antimicrobial Peptides.ACS Infect Dis. 2024 Jan 12;10(1):79-92. doi: 10.1021/acsinfecdis.3c00206. Epub 2023 Dec 19. ACS Infect Dis. 2024. PMID: 38113038 Free PMC article.
References
-
- Stubbe J, van der Donk WA. Chem. Rev. 1998;98:705–762. - PubMed
-
- Jordan A, Reichard P. Annu. Rev. Biochem. 1998;67:71–98. - PubMed
-
- Nordlund P, Reichard P. Annu. Rev. Biochem. 2006;75:681–706. - PubMed
-
- Uhlin U, Eklund H. Nature. 1994;370:533–539. - PubMed
-
- Eriksson M, Uhlin U, Ramaswamy S, Ekberg M, Regnstrom K, Sjöberg B-M, Eklund H. Structure. 1997;5:1077–1092. - PubMed
Publication types
MeSH terms
Substances
Grants and funding
LinkOut - more resources
Full Text Sources
Molecular Biology Databases
Research Materials
