. 2010 Jun;26(6):663-79.
doi: 10.1089/aid.2009.0168.

Neuropathogenic SIVsmmFGb genetic diversity and selection-induced tissue-specific compartmentalization during chronic infection and temporal evolution of viral genes in lymphoid tissues and regions of the central nervous system

Affiliations

Neuropathogenic SIVsmmFGb genetic diversity and selection-induced tissue-specific compartmentalization during chronic infection and temporal evolution of viral genes in lymphoid tissues and regions of the central nervous system

Aaron B Reeve et al. AIDS Res Hum Retroviruses. 2010 Jun.

Abstract

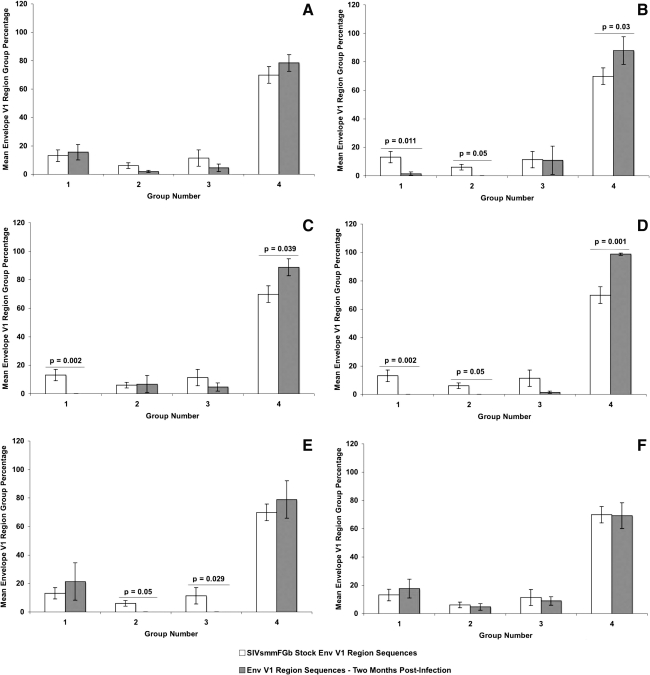
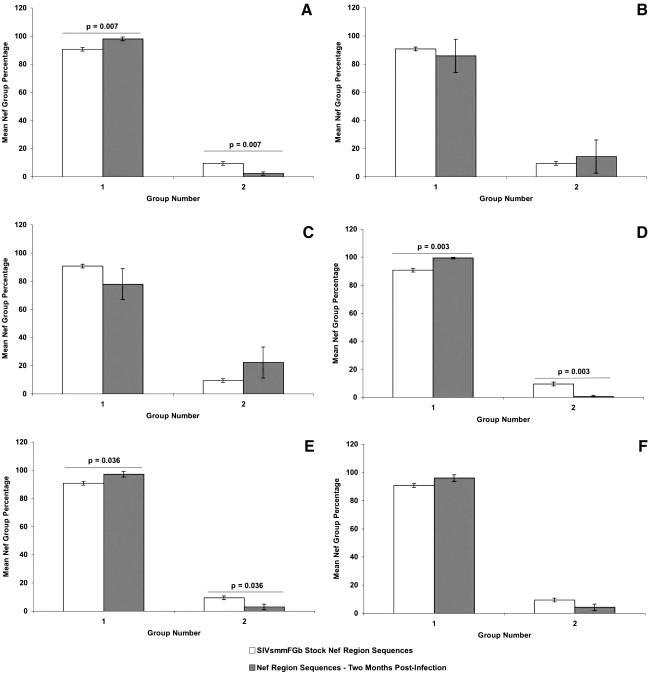
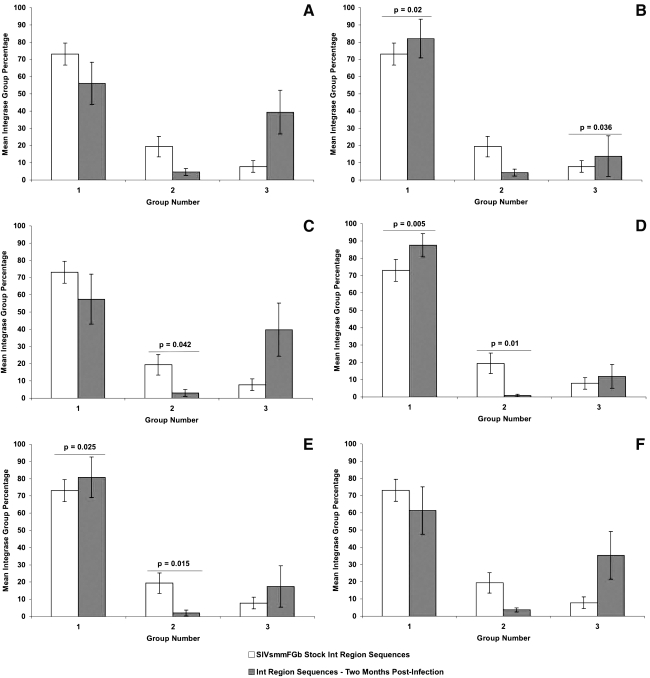
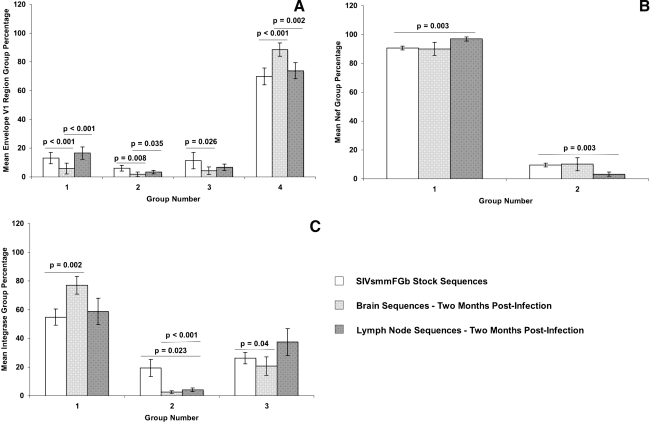
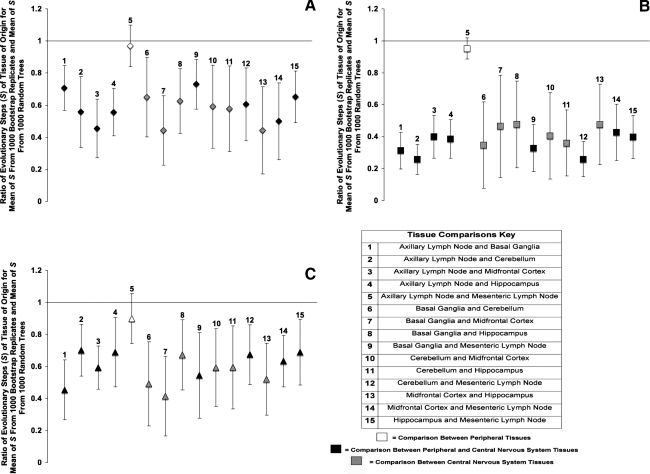
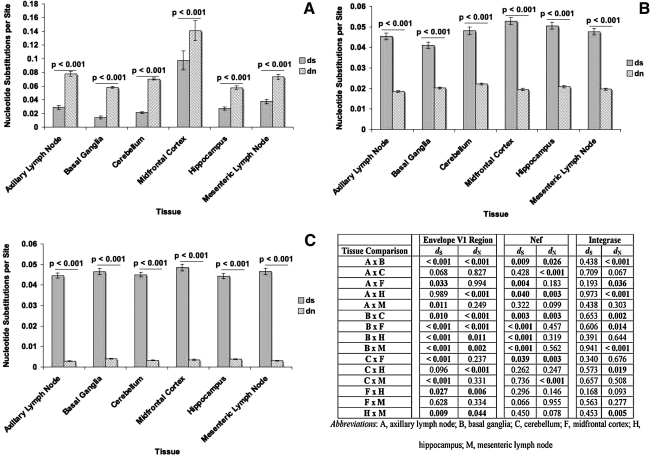
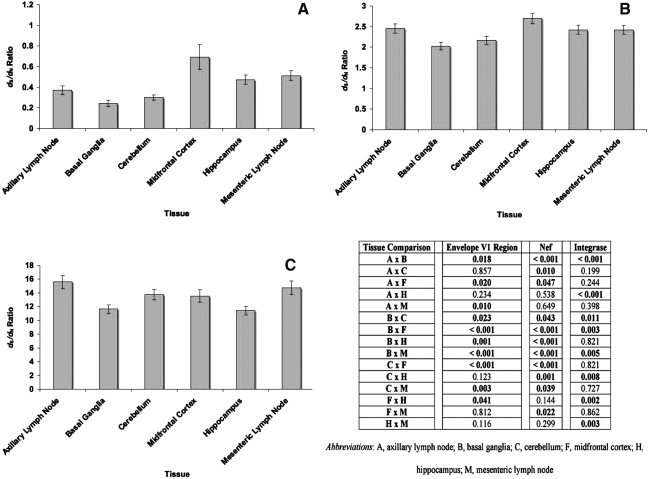
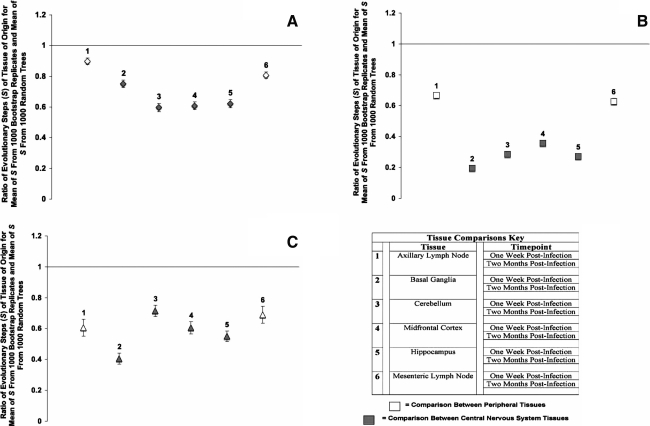
SIVsmmFGb is a lentivirus swarm that induces neuropathology in over 90% of infected pigtailed macaques and reliably models central nervous system HIV infection in people. We have previously studied SIVsmmFGb genetic diversity and compartmentalization during acute infection, but little is understood about diversity and intertissue compartmentalization during chronic infection. Tissue-specific pressure appeared to affect the diversity of Nef sequences between tissues, but changes to the Env V1 region and Int diversity were similar across all tissues. At 2 months postinfection, compartmentalization of the SIVsmmFGb env V1 region, nef, and int was noted between different brain regions and between brain regions and lymph nodes. Convergent evolution of the nef and env V1 region, and divergent evolution of int, was noted between compartments and all genes demonstrated intratissue temporal segregation. For the env V1 region and nef, temporal segregation was stronger in the brain regions than the periphery, but little difference between tissues was noted for int. Positive selection of the env V1 region appeared in most tissues at 2 months postinfection, whereas nef and int faced negative selection in all tissues. Positive selection of the env V1 region sequences increased in some brain regions over time. SIVsmmFGb nef and int sequences each saw increased negative selection in brain regions, and one lymph node, over the course of infection. Functional differences between tissue compartments decreased over time for int and env V1 region sequences, but increased for nef sequences.


Figures

FIG. 1.
FIG. 1.
Comparison of Env V1 region group percentages between SIVsmmFGb stock virus and tissues harvested from pigtailed macaques at 2 m.p.i. Env V1 region amino acid sequences obtained from the SIVsmmFGb stock virus were aligned and grouped as previously described. Env V1 amino acid sequences from tissues harvested at 2 m.p.i. were grouped as described in Materials and Methods. The percentage of sequences in each group from each tissue was determined for each animal and averaged to yield a mean percentage for each group in each tissue across all animals. The percentage of each group in the SIVsmmFGb stock virus was compared statistically to the mean percentage of each group in the tissues using the Mann–Whitney rank sum test. Statistically significant differences (p < 0.05) are noted. Error bars represent 1 standard error. Results are for Env V1 region sequences from the (A) axillary lymph node, (B) basal ganglia, (C) cerebellum, (D) midfrontal cortex, (E) hippocampus, and (F) mesenteric lymph node.
FIG. 2.
FIG. 2.
Comparison of Nef group percentages between SIVsmmFGb stock virus and tissues harvested from pigtailed macaques at 2 m.p.i. Nef amino acid sequences obtained from the SIVsmmFGb stock virus were aligned and grouped as previously described. Nef amino acid sequences from tissues harvested at 2 m.p.i. were grouped as described in Materials and Methods. The percentage of sequences in each group from each tissue was determined for each animal and averaged to yield a mean percentage for each group in each tissue across all animals. The percentage of each group in the SIVsmmFGb stock virus was compared statistically to the mean percentage of each group in the tissues using the Mann–Whitney rank sum test. Statistically significant differences (p < 0.05) are noted. Error bars represent 1 standard error. Results are for Nef sequences from the (A) axillary lymph node, (B) basal ganglia, (C) cerebellum, (D) midfrontal cortex, (E) hippocampus, and (F) mesenteric lymph node.
FIG. 3.
FIG. 3.
Comparison of Int group percentages between SIVsmmFGb stock virus and tissues harvested from pigtailed macaques at 2 m.p.i. Int amino acid sequences obtained from the SIVsmmFGb stock virus were aligned and grouped as described. Int amino acid sequences from tissues harvested at 2 m.p.i. were grouped as described in Materials and Methods. The percentage of sequences in each group from each tissue was determined for each animal and averaged to yield a mean percentage for each group in each tissue across all animals. The percentage of each group in the SIVsmmFGb stock virus was compared statistically to the mean percentage of each group in the tissues using the Mann–Whitney rank sum test. Statistically significant differences (p < 0.05) are noted. Error bars represent 1 standard error. Results for Int sequences are from the (A) axillary lymph node, (B) basal ganglia, (C) cerebellum, (D) midfrontal cortex, (E) hippocampus, and (F) mesenteric lymph node.
FIG. 4.
FIG. 4.
Comparison of sequence group percentages between the SIVsmmFGb stock virus and sequences harvested from the CNS and lymph node at 2 m.p.i. Amino acid sequences for all three genes obtained from the SIVsmmFGb stock virus were aligned and grouped as described. Amino acid sequences for the (A) Env V1 region, (B) Nef, and (C) Int harvested from tissues at 2 m.p.i. were grouped as described in Materials and Methods. Sequence group percentages for all CNS tissues from all animals were averaged to yield a mean percentage for each group in the CNS, with a similar procedure conducted for lymph node-derived sequences. The percentage of each group in the SIVsmmFGb stock was compared statistically to the mean group percentage in CNS and lymph nodes using the Mann–Whitney rank sum test. A similar comparison was performed between the means of the CNS and lymph node pools. Statistically significant differences (p < 0.05) are noted and error bars represent 1 standard error.
FIG. 5.
FIG. 5.
Phylogenetic analysis of SIVsmmFGb compartmentalization between tissues harvested from pigtailed macaques at 2 m.p.i. (A) Env V1 region, (B) Nef, and (C) Int compartmentalization was determined using a modified Slatkin–Maddison test as described in Materials and Methods. Error bars represent 2 standard errors of the determined S ratio; significant compartmentalization between tissues is indicated by ratios more than 2 standard errors less than 1.
FIG. 6.
FIG. 6.
dS and dN values for (A) env V1 region, (B) nef, and (C) int sequences isolated from tissues of SIVsmmFGb-infected pigtailed macaques sacrificed at 2 m.p.i. Average dS and dN values for each tissue were determined as described and compared statistically using the Mann–Whitney rank sum test as described in Materials and Methods. Statistically significant differences (p < 0.05) are noted. Error bars represent 1 standard error. dS and dN intertissue comparisons, by the Mann–Whitney rank sum test, for all three genes are provided in the accompanying table; statistically significant differences (p ≤ 0.05) are noted.
FIG. 7.
FIG. 7.
Average dS/dN values for (A) env V1 region, (B) nef, and (C) int sequences isolated from tissues of SIVsmmFGb-infected pigtailed macaques sacrificed at 2 m.p.i. Mean dS/dN values for each tissue were determined, and statistical comparisons were made, as described in Materials and Methods. Error bars represent 1 standard error. dS dN ratio intertissue comparisons for env V1 region, nef, and int are provided in the accompanying table; statistically significant differences (p ≤ 0.05) by the Mann–Whitney rank sum test are noted.
FIG. 8.
FIG. 8.
Phylogenetic analysis of temporal compartmentalization of SIVsmmFGb sequences within the same tissue harvested from pigtailed macaques at 1 w.p.i. and 2 m.p.i. (A) Env V1 region, (B) Nef, and (C) Int compartmentalization was determined using a modified Slatkin–Maddison test as described in Materials and Methods. Error bars represent 2 standard errors of the determined S ratio; significant compartmentalization between tissues is indicated by ratios more than 2 standard errors less than 1. Some sequences for the Env V1 region, Nef, and Int could not be obtained from animal PQo1 at 1 w.p.i. as described.

Similar articles

Cited by

References

    1. UNAIDS. AIDS Epidemic Update. 2007.
    1. Luo W. Peterlin BM. Activation of the T-cell receptor signalling pathway by Nef from an aggressive strain of simian immunodeficiency virus. J Virol. 1997;71:9531–9537. - PMC - PubMed
    1. Glenn AA. Novembre FJ. A single amino acid change in gp41 is linked to the macrophage-only replication phenotype of a molecular clone of simian immunodeficiency virus derived from the brain of a macaque with neuropathogenic infection. Virology. 2004;325:297–307. - PubMed
    1. Hahn BH. Shaw GM. deCock KM. Sharp PM. AIDS as a zoonosis: Scientific and public health implications. Science. 2000;287:607–614. - PubMed
    1. O'Neil SP. Suwyn C. Anderson DC. Niedziela G. Bradley J. Novembre FJ. Herndon JG. McClure HM. Correlation of acute humoral response with brain virus burden and survival time in pigtailed macaques infected with the neurovirulent simian immunodeficiency virus SIVsmmFGb. Am J Pathol. 2004;164:1157–1172. - PMC - PubMed

Publication types

MeSH terms

Associated data

LinkOut - more resources