

Global estimates of ambient fine particulate matter concentrations from satellite-based aerosol optical depth: development and application
- PMID: 20519161
- PMCID: PMC2898863
- DOI: 10.1289/ehp.0901623
Global estimates of ambient fine particulate matter concentrations from satellite-based aerosol optical depth: development and application
Abstract
Background: Epidemiologic and health impact studies of fine particulate matter with diameter < 2.5 microm (PM2.5) are limited by the lack of monitoring data, especially in developing countries. Satellite observations offer valuable global information about PM2.5 concentrations.
Objective: In this study, we developed a technique for estimating surface PM2.5 concentrations from satellite observations.
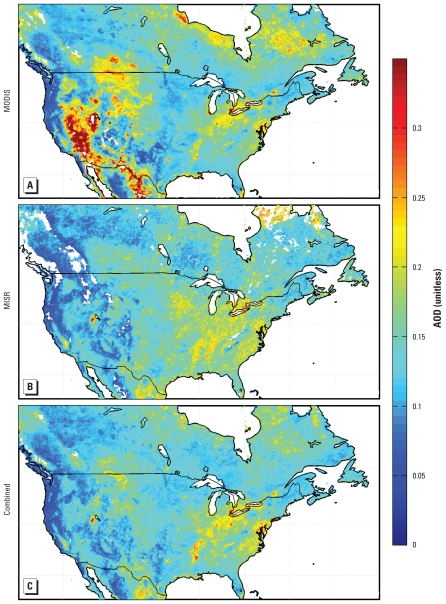
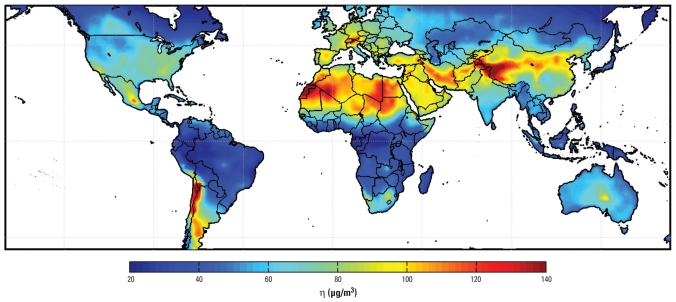
Methods: We mapped global ground-level PM2.5 concentrations using total column aerosol optical depth (AOD) from the MODIS (Moderate Resolution Imaging Spectroradiometer) and MISR (Multiangle Imaging Spectroradiometer) satellite instruments and coincident aerosol vertical profiles from the GEOS-Chem global chemical transport model.
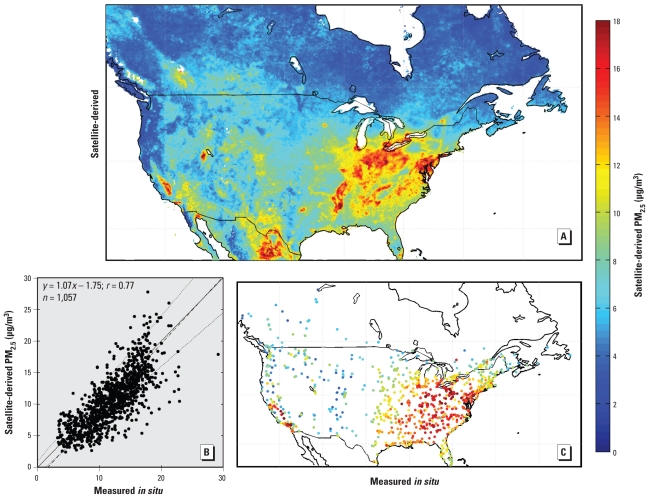
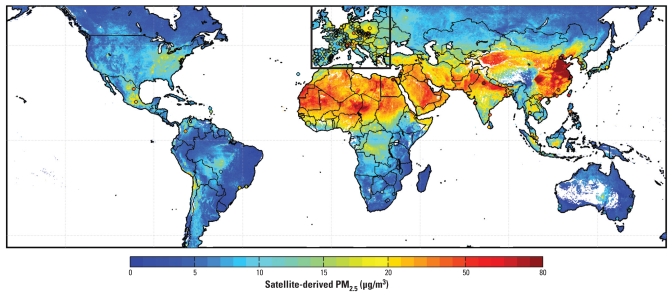
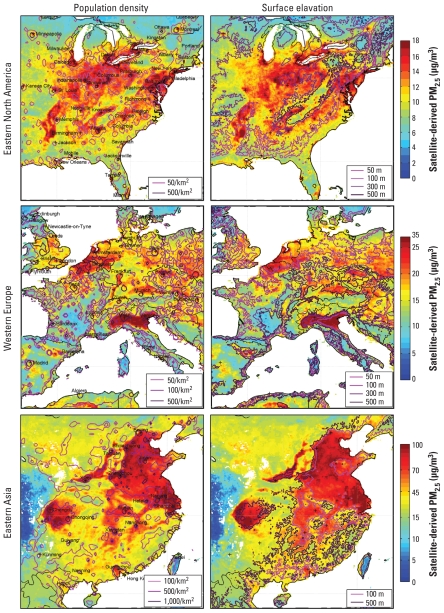
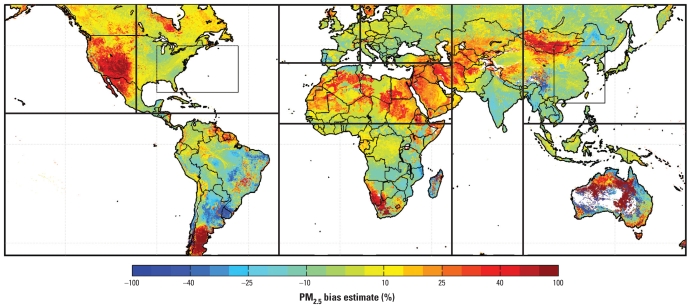
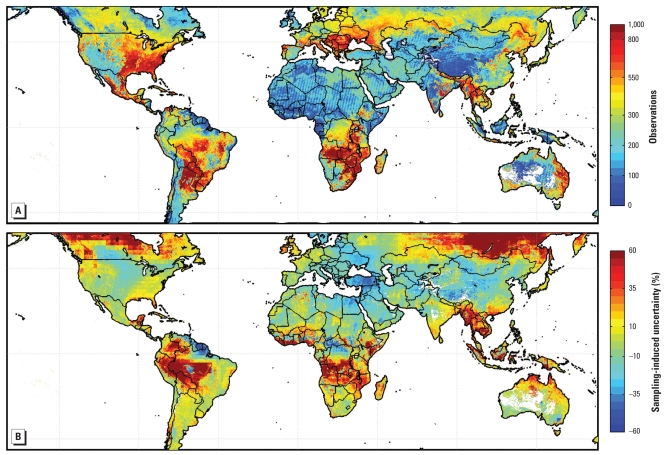
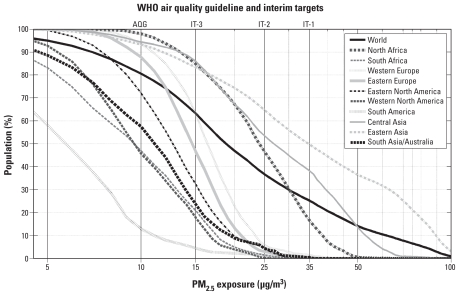
Results: We determined that global estimates of long-term average (1 January 2001 to 31 December 2006) PM2.5 concentrations at approximately 10 km x 10 km resolution indicate a global population-weighted geometric mean PM2.5 concentration of 20 microg/m3. The World Health Organization Air Quality PM2.5 Interim Target-1 (35 microg/m3 annual average) is exceeded over central and eastern Asia for 38% and for 50% of the population, respectively. Annual mean PM2.5 concentrations exceed 80 microg/m3 over eastern China. Our evaluation of the satellite-derived estimate with ground-based in situ measurements indicates significant spatial agreement with North American measurements (r = 0.77; slope = 1.07; n = 1057) and with noncoincident measurements elsewhere (r = 0.83; slope = 0.86; n = 244). The 1 SD of uncertainty in the satellite-derived PM2.5 is 25%, which is inferred from the AOD retrieval and from aerosol vertical profile errors and sampling. The global population-weighted mean uncertainty is 6.7 microg/m3.
Conclusions: Satellite-derived total-column AOD, when combined with a chemical transport model, provides estimates of global long-term average PM2.5 concentrations.
Figures
Comment in
-
Keeping an eye on PM2.5: satellite data reveal global picture of particulate pollution.Environ Health Perspect. 2010 Jun;118(6):A259. doi: 10.1289/ehp.118-a259a. Environ Health Perspect. 2010. PMID: 20515715 Free PMC article. No abstract available.
-
A hybrid approach for predicting PM2.5 exposure.Environ Health Perspect. 2010 Oct;118(10):A425; author reply A426. doi: 10.1289/ehp.1002706. Environ Health Perspect. 2010. PMID: 20884398 Free PMC article. No abstract available.
References
-
- Chen C-H, Liu W-L, Chen C-H. Development of a multiple objective planning theory and system for sustainable air quality monitoring networks. Sci Total Environ. 2006;354:1–19. - PubMed
-
- Cohen AJ, Anderson HR, Ostro B, Pandey KD, Krzyzanowski M, Kuenzli N, et al. Mortality impacts of urban air pollution. In: Ezzati M, Lopez AD, Rodgers A, Murray CJL, editors. Comparative Quantification of Health Risks: Global and Regional Burden of Disease Due to Selected Major Risk Factors. Vol. 2. Geneva: World Health Organization; 2004.
-
- Di Girolamo L, Bond TC, Bramer D, Diner DJ, Fettinger F, Kahn RA, et al. Analysis of Multi-Angle Imaging Spectroradiometer (MISR) aerosol optical depths over greater India during winter 2001–2004. Geophys Res Lett. 2004;31:L23115. doi: 10.1029/2004GL021273. - DOI
-
- Diner D, Beckert J, Reilly T, Bruegge C, Conel J, Kahn R, et al. Multiangle Imaging SpectroRadiometer (MISR) instrument description and experiment overview. IEEE Trans Geosci Rem Sens. 1998;36:1072–1087.
Publication types
MeSH terms
Substances
LinkOut - more resources
Full Text Sources
Other Literature Sources
Medical