Review
. 2010 Aug 6;7 Suppl 4(Suppl 4):S411-22.
doi: 10.1098/rsif.2010.0158.focus. Epub 2010 Jun 2.

A review of nanoparticle functionality and toxicity on the central nervous system

Affiliations
Review

A review of nanoparticle functionality and toxicity on the central nervous system

Z Yang et al. J R Soc Interface. .

Abstract

Although nanoparticles have tremendous potential for a host of applications, their adverse effects on living cells have raised serious concerns recently for their use in the healthcare and consumer sectors. As regards the central nervous system (CNS), research data on nanoparticle interaction with neurons has provided evidence of both negative and positive effects. Maximal application dosage of nanoparticles in materials to provide applications such as antibacterial and antiviral functions is approximately 0.1-1.0 wt%. This concentration can be converted into a liquid phase release rate (leaching rate) depending upon the host or base materials used. For example, nanoparticulate silver (Ag) or copper oxide (CuO)-filled epoxy resin demonstrates much reduced release of the metal ions (Ag(+) or Cu(2+)) into their surrounding environment unless they are mechanically removed or aggravated. Subsequent to leaching effects and entry into living systems, nanoparticles can also cross through many other barriers, such as skin and the blood-brain barrier (BBB), and may also reach bodily organs. In such cases, their concentration or dosage in body fluids is considered to be well below the maximum drug toxicity test limit (10(-5) g ml(-1)) as determined in artificial cerebrospinal solution. As this is a rapidly evolving area and the use of such materials will continue to mature, so will their exposure to members of society. Hence, neurologists have equal interests in nanoparticle effects (positive functionality and negative toxicity) on human neuronal cells within the CNS, where the current research in this field will be highlighted and reviewed.


Figures

Figure 1.
Figure 1.
Scanning electron micrograph (SEM) showing multi-wall carbon nanotubes.
Figure 2.
Figure 2.
Transmission electron micrograph (TEM) of (a) CuO nanoparticles (QinetiQ Nanomaterials Ltd) and (b) agglomerated silver nanoparticles.
Figure 3.
Figure 3.
Neuron synaptic transmission and neuron cell membrane with passes for Ca2+, Na+, K+ and Cl (interactive physiology), where carbon nanotubes or smaller nanoparticles might be able to pass through easily.
Figure 4.
Figure 4.
Scanning electron micrograph (SEM) of carbon nanotubes reinforced with epoxy resin (scale bar, 5 μm).
Figure 5.
Figure 5.
Schematic of hippocampal pathways.
Figure 6.
Figure 6.
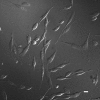
Confocal image of PC-12 cells used in toxicity studies. The cell lengths are approximately 25–30 µm under the confocal microscope before cell-line proliferation. However, after the cell division their lengths could grow up to several hundred micrometres (scale bar, 10 μm).
Figure 7.
Figure 7.
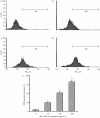
Measurement of ROS generation in PC-12 cells by flow cytometry. The cells were cultured with nano-TiO2 at concentrations of (a) 0 µg ml−1, (b) 10 µg ml−1, (c) 50 µg ml−1 and (d) 100 µg ml−1 for 24 h. ROS levels are dose dependent. The corresponding linear diagram of flow cytometry is shown (e). n = 3; mean ± SEM; *statistically significant difference compared with controls (p < 0.05); **p < 0.01 (Liu et al. 2010).
Figure 8.
Figure 8.
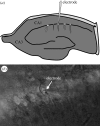
(a) Schematic diagram of hippocampal CA1 pyramidal neurons in the brain. (b) Whole cell patch clamp recording in CA1 pyramidal neuron from 14–18 Wistar rats.
Figure 9.
Figure 9.
Experimental set-up for recording the response of neuron cells in ion channel currents.
Figure 10.
Figure 10.
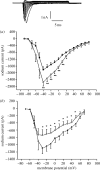
The original traces of (a)(i)(ii) IA and (b)(i)(ii) IK. The contrasting effects of ZnO and CuO nanoparticles on IV currents and peak amplitudes of IA and IK on hippocampal pyramidal neurons from Wistar rats (Xu et al. 2009; Zhao et al. 2009). (a,b) (i) Filled square, control; open circle, nano-ZnO; (a,b) (ii) open square, control; open circle, nano-CuO.
Figure 11.
Figure 11.
The original traces of the INa. (a) The increased effects of the nano-ZnO (filled square, control; open circle, nano-ZnO) and (b) decreased effects of nano-Ag on IV currents and peak amplitudes of INa on hippocampal pyramidal neurons from Wistar rats (Liu et al. 2009; Zhao et al. 2009 filled square, control; open circle, nano-Ag).

References

    1. Allaker R. P., Ren G. 2008. Potential impact of nanotechnology on the control of infectious diseases. Trans. R. Soc. Trop. Med. Hygiene 102, 1–2. (10.1016/j.trstmh.2007.07.003) - DOI - PMC - PubMed
    1. Au C., Mutkus L., Dobson A., Riffle J., Lalli J., Aschner M. 2007. Effects of nanoparticles on the adhesion and cell viability on astrocytes. Biol. Trace Elem. Res. 120, 248–256. (10.1007/s12011-007-0067-z) - DOI - PubMed
    1. Belyanskaya L., Weigel S., Hirsch C., Tobler U., Krug H. F., Wick P. 2009. Effects of carbon nanotubes on primary neurons and glial cells. Neurotoxicology 30, 702–711. (10.1016/j.neuro.2009.05.005) - DOI - PubMed
    1. Brooking J., Davis S. S., Illum L. 2001. Transport of nanoparticles across the rat nasal mucosa. J. Drug Targeting 9, 267–279. (10.3109/10611860108997935) - DOI - PubMed
    1. Cha K. E., Myung H. 2007. Cytotoxic effects of nanoparticles assessed in vitro and in vivo. J. Microbial Biotechnol. 17, 1573–1578. - PubMed

Publication types

LinkOut - more resources