. 2010 Aug 1;588(Pt 15):2745-68.
doi: 10.1113/jphysiol.2010.190389. Epub 2010 Jun 2.

Sprouting capacity of lumbar motoneurons in normal and hemisected spinal cords of the rat

Affiliations

Sprouting capacity of lumbar motoneurons in normal and hemisected spinal cords of the rat

T Gordon et al. J Physiol. .

Abstract

Nerve sprouting to reinnervate partially denervated muscles is important in several disease and injury states. To examine the effectiveness of sprouting of active and inactive motor units (MUs) and the basis for a limit to sprouting, one of three rat lumbar spinal roots was cut under normal conditions and when the spinal cord was hemisected at T12. Muscle and MU isometric contractile forces were recorded and muscle fibres in glycogen-depleted single muscle units enumerated 23 to 380 days after surgery. Enlargement of intact MUs by sprouting was effective in compensating for up to 80% loss of innervation. For injuries that removed >70-80% of the intact MUs, muscle contractile force and weight dropped sharply. For partial denervation of <70%, all MUs increased contractile force by the same factor in both normally active muscles and muscles whose activity was reduced by T12 hemisection. Direct measurements of MU size by counting glycogen-depleted muscle fibres in physiologically and histochemically defined muscle units, provided direct evidence for a limit in MU size, whether or not the activity of the muscles was reduced by spinal cord hemisection. Analysis of spatial distribution of muscle fibres within the outer boundaries of the muscle unit demonstrated a progressive increase in fibres within the territory to the limit of sprouting when most of the muscle unit fibres were adjacent to each other. We conclude that the upper limit of MU enlargement may be explained by the reinnervation of denervated muscle fibres by axon sprouts within the spatial territory of the muscle unit, formerly distributed in a mosaic pattern.


Figures

Figure 1
Figure 1. Recording in vivo of muscle and motor unit electromyographic (EMG) signals and isometric twitch forces from the tibialis anterior (TA) muscle
A. The innervation to the TA muscle was isolated by cutting all nerve branches in the hindlimb other than the common peroneal (CP) nerve supplying the TA muscle. Ventral root filaments were teased for stimulation via a triphasic array of electrodes to evoke all-or-none increments in EMG and twitch force. The array was used to isolate the stimulus to the ventral root filament that was contained within an oil pool around the open spinal cord after the laminectomy. B, all-or-none EMG and twitch contractile forces that were elicited by incremental stimulation of 3 different motor axons. The twitch contractile forces of the second and third motor units were obtained by subtraction of the first twitch contraction from the second and the combined force of the first and second motor units from the third increment in twitch contractile force.
Figure 4
Figure 4. The frequency distributions of the percentage contributions of L3 (A), L4 (B) and L5 (C) ventral roots to the motor innervation of the tibialis anterior (TA) muscle
The distributions are skewed and demonstrate the relatively small contributions of the L3 and L5 ventral roots to the innervation of TA muscle with the majority of the contribution coming from the L4 ventral root.
Figure 2
Figure 2. Photographs and camera lucida drawings of periodic-Schiff (PAS)-stained cross-sections of tibialis anterior (TA) muscles of normal (A and B) and partially denervated (C and D) hindlimbs showing glycogen-depleted muscle units
The 88 glycogen-depleted white muscle fibres in the normal muscle unit are intermingled with pink non-unit muscle fibres in a mosaic distribution (A); fibres occupy a defined area of territory within the cross-secction of the muscle (B). The territory area is contained within lines that connect the most outermost muscle unit fibres (not shown), see Methods for details). The 354 fibres in the muscle unit in the partially denervated muscle occupy a territory of similar size but their numbers are obviously higher and the fibres are distributed in clumps within the muscle unit territory (C and D). Note that the muscle unit fibres in both the normal and partially denervated muscles are contained in several fascicles (A and C).
Figure 3
Figure 3. Bilateral symmetry of the lumbosacral motor axons that exit through the ventral roots on the left and right sides in normal unoperated control rats
The left and right tibialis anterior (TA) muscle tetanic forces evoked by stimulation of the L4 ventral root at 100 Hz were expressed as a ratio of the tetanic forces evoked by suprathreshold stimulation of the sciatic nerve. These measurements showed that there was bilateral symmetry in the total muscle force as well as in the root contributions to the TA muscle.
Figure 11
Figure 11. Frequency distributions of the mean cross-sectional area of the muscle fibres in isolated single motor units and the relationship between these areas and motor unit tetanic forces for the single muscle units in normally innervated tibialis anterior (TA) muscles and partially denervated. TA muscles in rats with intact and hemisected spinal cords
The frequency distribution of the mean cross-sectional areas of muscle fibres in isolated single motor units of 17 normally innervated (A) and 14 partially denervated TA muscles (B). The means ±s.e.m. for motor unit fibre area were 2138 ± 645 μm2 (A) and 2236 (± 645) μm2 (B) for the normally and partially denervated muscles, respectively. The regression lines in the double logarithmic plot of the cross-sectional areas of the muscle fibres (Unit CSA) and their tetanic contractile force in control (C) and partially denervated muscles (D) have slopes ±s.e.m. of 0.61 ± 0.19 and 0.34 ± 0.08 that were significantly different from zero (P < 0.01). These demonstrated the linear relationship between the mean muscle fibre cross-sectional area and the force generated by those muscle fibres. The correlation coefficients were 0.53 and 0.64, respectively. The vertical bars shown above the histograms are the mean values.
Figure 10
Figure 10. Frequency distributions of the number of muscle fibres in an isolated single motor unit (N) and the relationship between the muscle unit fibre number and the motor unit tetanic force in normally innervated and partially denervated tibialis anterior (TA) muscles under conditions of the spinal cord remaining intact or hemisected
The frequency distribution of the number of muscle fibres in isolated single motor units of 17 normally innervated (A) and 14 partially denervated TA muscles, of which the neuromuscular activity was reduced in 5 TA muscles by spinal cord hemisection at T12 (B). The means values (±s.e.m.) for motor unit numbers of 118 ± 8 (A) and 263 ± 52 (B) for the normally and partially denervated muscles, respectively, were significantly different as indicated by the asterisk in B. The regression lines in the double logarithmic plots of the number of muscle fibres (N) and tetanic contractile force developed by the same motor unit in control (C), and partially denervated muscles (D) have slopes (±s.e.m.) of 0.26 ± 0.07 and 0.56 ± 0.08 that were significantly different from zero (P < 0.01). These demonstrated the linear relationship between the muscle fibre number and the force generated by those muscle fibres. The correlation coefficients were 0.51 and 0.80.
Figure 7
Figure 7. Tetanic contractile forces and muscle wet weights as a function of days of recovery after partial denervation
A, the tetanic contractile forces and B, muscle wet weights of partially denervated tibialis anterior (TA) muscles in the left hindlimb, expressed as a ratio of the forces and weights of the corresponding innervated TA muscles in the right hindlimb, are plotted as a function of days of recovery after partial denervation under conditions of intact (PD) and hemisected (SCPD) spinal cords. The muscles that suffered <75% and >75% partial denervation (PD) are shown, as well as those muscles that were completely denervated by the root section (100% Denervated). The points that fall below ∼1.0 are those that suffered partial denervation of >75% with complete recovery occurring as soon as 30 days after the root transection.
Figure 5
Figure 5. Tetanic isometric contractile forces (A) and muscle wet weights (B) of partially denervated tibialis anterior (TA) muscles in the left hindlimb plotted on double logarithmic scales as a function of the corresponding forces and weights of the intact control TA muscles in the intact right hindlimb under conditions of an intact and a hemisected spinal cord
The points that fall on the line of unity slope are those in which the partially denervated (PD) muscles develop as much force and have the same wet weights as the intact contralateral muscles. The points falling to the right of the line demonstrate that the muscles do not develop as much force or are less heavy than the corresponding normally intact muscles on the contralateral left side of the rats. Muscles that were fully denervated by section of one ventral root are also shown. The total number of data points is 41 and 57 in A and B, respectively. Symbols are shown in the insets. SCPD, spinal cord partially denervated.
Figure 6
Figure 6. Tetanic contractile forces and muscle wet weights as a function of the per cent partial denervation
The tetanic contractile forces (A) and muscle wet weights (B) of partially denervated tibialis anterior (TA) muscles in the left hindlimb expressed as a ratio of the forces and weights of the corresponding innervated TA muscles in the right hindlimb, are plotted as a function of the per cent partial denervation under conditions of intact (•) and hemisected (formula image 
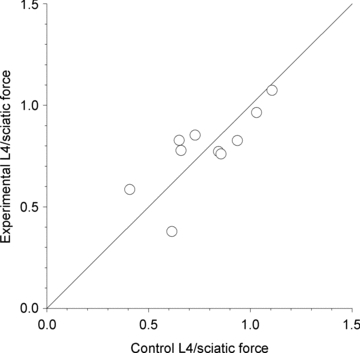
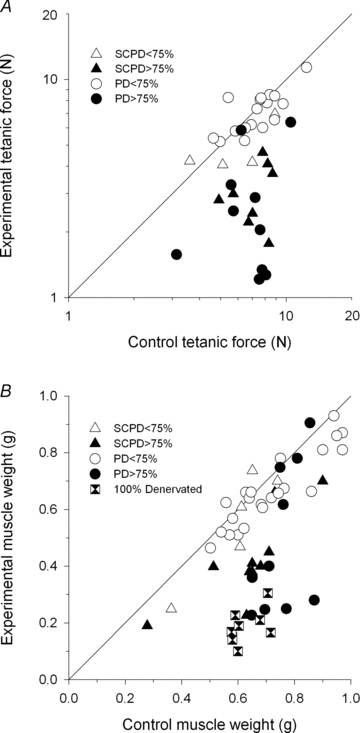
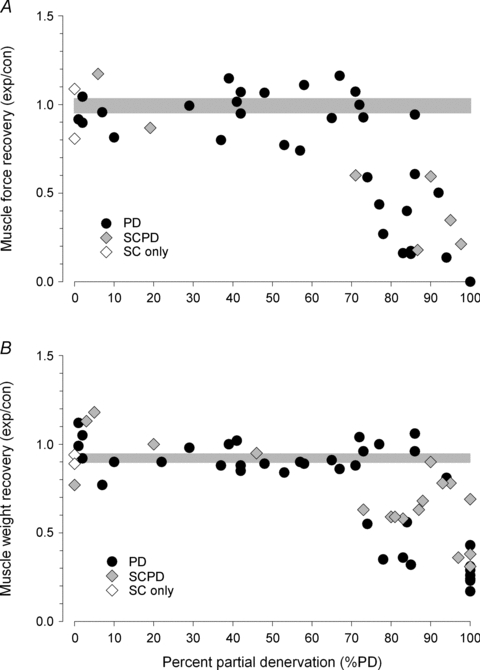
spinal cords. The points that fall on the line of slope unity are those in which the partially denervated muscles develop as much force and are as heavy as those in the intact muscles. The points in Fig. 5 were averaged and the ±s.e.m. values are shown as grey lines in the plots. Full muscle force and weight recoveries extended as far as 80–85% partial denervation but the majority of the data fell sharply in muscles that were partially denervated by >70–75%. Muscle forces and weights were not different for data collected for the rats with intact and hemisected spinal cords: the mean ±s.e.m.s for muscle forces were 0.40 ± 0.07 and 0.40 ± 0.5 and for muscle weights were 0.63 ± 0.09 and 0.66 ± 0.05. The total number of data points is 41 and 57 in A and B, respectively.
Figure 8
Figure 8. Frequency histograms and cumulative frequency histograms of the twitch contractile forces of single motor units
AC, frequency histograms and D, cumulative frequency histograms of the twitch contractile forces of single motor units recorded from tibialis anterior (TA) muscles in intact hindlimbs and hindlimbs partially denervated by cutting 1 of 3 ventral roots, are plotted on semi-logarithmic scales. The mean (±s.e.m.) of the twitch forces increased significantly from 7.6 (± 0.42) mN in control intact muscles (A), to 13.5 (± 1.25) mN for 35% partial denervation (PD) (B) and 33.1 (± 3.6) mN for 70% partial denervation (C). The force distributions are progressively moved to the right with partial denervation that progressively removes 35% and 70% of the contributing ventral root axons that supply the TA muscle. In D, the rightward shifts of the cumulative frequency histograms were significant (Kolmogorov test, P < 0.01) although there was a clear trend for there to be greater motor enlargement for the larger than the smaller motor units. The vertical bars shown above the histograms are the mean values. The same bars are in Figures 10, 11, and 12.
Figure 12
Figure 12. Frequency distributions of the specific force of isolated single motor units and the relationship between the specific force and the motor unit tetanic force in normally innervated and partially denervated tibialis anterior (TA) muscles under conditions of the spinal cord remaining intact or hemisected
The frequency distribution of the specific force of isolated single motor units of 13 normally innervated (A) and 13 partially denervated TA muscles, of which the neuromuscular activity was reduced in 5 TA muscles by spinal cord hemisection at T12 (B). The mean values ±s.e.m. for specific force of 2.83 ± 0.58 and 2.17 ± 0.47 cm2 for the normally and partially denervated muscles, respectively, were not significantly different. The regression lines in double logarithmic plots of the specific force and tetanic contractile force developed by the same motor unit in control (C) and partially denervated muscles (D) had slopes ±s.e.m. of 0.55 ± 0.25 and 0.33 ± 0.12 that were not significantly different from zero (P > 0.05). Hence the specific force of all motor units did not vary systematically with tetanic force as demonstrated for the number and cross-sectional area of muscle unit fibres.
Figure 9
Figure 9. Motor unit twitch contractile force and fibre number as a functional of per cent partial denervation of the muscle
A, the mean (±s.d.) of the twitch forces of single motor units recorded from rats (A) and the number of glycogen-depleted muscle fibres of single isolated muscle units, the motor unit fibre number (N) plotted as a function of the per cent partial denervation of the tibialis anterior (TA) in rats with intact and unilaterally transected spinal cords (B). Theoretical exponential lines are drawn to represent the exponential increase expected if there were no limit to the extent of enlargement of motor units with respect to either motor unit twitch forces or motor unit fibre numbers after partial denervation. Motor units: SO, slow oxidative; FOG, fast oxidative glycolytic; Fint, fatigue intermediate; FG, fast glycolytic.
Figure 14
Figure 14. Photographs of muscle cross-sections stained for acid mATPase and camera lucida drawings of glycogen-depleted muscle fibres
Photographs of muscle cross-sections stained for acid mATPase (A, B, E and F) and camera lucida drawings of glycogen-depleted muscle fibres identified by absence of periodic acid Schiff (PAS) staining (C, D, G and H) in tibialis anterior (TA) muscles with 100% remaining motor units (intact control) (A and C), 60% (B and D), 20% (E and G), and 15% (F and H) remaining intact motor units active cutting one ventral root in the lumbosacral spinal cord. Progressive clumping of muscle fibre types and of glycogen-depleted muscle fibres occurs with progressive reduction in numbers of intact motor units, i.e. progressive partial muscle denervation. The numbers of muscle unit fibres are 109, 209, 572 and 696 in C, D, G and H. The corresponding tetanic forces of the muscle units were 52.5, 82, 360 and 524 mN.
Figure 13
Figure 13. Camera lucida drawings of glycogen-depleted muscle fibres
Camera lucida drawings of glycogen-depleted muscle fibres identified by absence of periodic acid Schiff (PAS) staining in muscles with 80% (A and B) and 10% (C and D) remaining motor units in partially denervated tibialis anterior (TA) muscles of rats with intact (A and C) and hemisected (B and D) spinal cords. The same progressive clumping of muscle fibre types (not shown) and of glycogen-depleted muscle fibres occurs with progressive reduction in numbers of intact motor units, i.e. progressive partial muscle denervation. The numbers of muscle unit fibres are 189, 144, 696 and 430 in A, B, C and D. The corresponding tetanic forces of the muscle units were 70, 57, 360 and 185 mN. The right hand side of the muscle cross-sections corresponds with the most superficial portion of the tibialis anterior muscle. The left hand side corresponds with the deep portion of the muscle.
Figure 15
Figure 15. Model of the distribution of muscle fibres in intact and partially denervated hindlimb skeletal muscles that are innervated by single motoneurons whose axons exit the spinal cord via L5 and/or L4 ventral roots
A, in normally innervated tibialis anterior (TA) muscle, the muscle fibres innervated by single axons (red, blue and black) in either L4 or L5 ventral roots show the typical mosaic distribution with muscle unit fibres intermingled with non-unit muscle fibres within a muscle unit territory that encloses all the muscle fibres innervated by intramuscular branching of motor nerves. B, after ‘moderate’ partial denervation by cutting 1 of the 2 ventral roots to remove 1 of 3 motor units, there are more muscle unit fibres that are adjacent to each other. C, after ‘extensive’ partial denervation, illustrated as the cutting of 2 of 3 axons, many more, here illustrated as all the muscle unit fibres, are adjacent to one another. Further details are provided in the text of the Discussion.

Similar articles

Cited by

References

    1. Bodine-Fowler SC, Garfinkel A, Roy RR, Edgerton VR. Spatial distribution of muscle fibres within the territory of a motor unit. Muscle Nerve. 1990;13:1133–1145. - PubMed
    1. Brooke MH, Kaiser KK. Muscle fibre types: how many and what kind. Arch Neurol. 1970;23:369–379. - PubMed
    1. Brown MC, Ironton R. Sprouting and regression of neuromuscular synapses in partially denervated mammalian muscles. J Physiol. 1978;278:325–348. - PMC - PubMed
    1. Brushart TM, Hoffman PN, Royall RM, Murinson BB, Witzel C, Gordon T. Electrical stimulation promotes motoneuron regeneration without increasing its speed or conditioning the neuron. J Neurosci. 2002;22:6631–6638. - PMC - PubMed
    1. Celichowski J, Krysciak K, Krutki P, Majczynski H, Gorska T, Slawinska U. Time-related changes of motor unit properties in the rat medial gastrocnemius muscle after the spinal cord injury. II. Effects of a spinal cord hemisection. J Electromyogr Kinesiol. 2009;20:532–541. - PubMed

Publication types