. 2010 Aug 1;21(15):2661-73.
doi: 10.1091/mbc.e09-12-1036. Epub 2010 Jun 2.

Phosphorylation controls autoinhibition of cytoplasmic linker protein-170

Affiliations

Phosphorylation controls autoinhibition of cytoplasmic linker protein-170

Ho-Sup Lee et al. Mol Biol Cell. .

Abstract

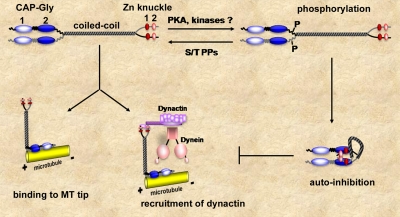
Cytoplasmic linker protein (CLIP)-170 is a microtubule (MT) plus-end-tracking protein that regulates MT dynamics and links MT plus ends to different intracellular structures. We have shown previously that intramolecular association between the N and C termini results in autoinhibition of CLIP-170, thus altering its binding to MTs and the dynactin subunit p150(Glued) (J. Cell Biol. 2004: 166, 1003-1014). In this study, we demonstrate that conformational changes in CLIP-170 are regulated by phosphorylation that enhances the affinity between the N- and C-terminal domains. By using site-directed mutagenesis and phosphoproteomic analysis, we mapped the phosphorylation sites in the third serine-rich region of CLIP-170. A phosphorylation-deficient mutant of CLIP-170 displays an "open" conformation and a higher binding affinity for growing MT ends and p150(Glued) as compared with nonmutated protein, whereas a phosphomimetic mutant confined to the "folded back" conformation shows decreased MT association and does not interact with p150(Glued). We conclude that phosphorylation regulates CLIP-170 conformational changes resulting in its autoinhibition.


Figures

Figure 1.
Figure 1.
Phosphatase inhibitor OA increases the affinity of H2 domain for C terminus of CLIP-170. (A) Schematic representation of CLIP-170 deletion mutants. S, serine-rich stretches; H, head domain. (B) The interaction between H1S or H2 and C-terminal domains. COS-1 cells coexpressing CLIP-170 deletion mutants (indicated in A) were left untreated or pretreated with OA for 30 min and were used for coIP with anti-GFP mAb. Resulting precipitates were probed with HA mAb and GFP polyclonal antibody. The relative expression levels of exogenous proteins is shown below, 3% of the whole cell extracts used for coIP. Note that deletion of the third serine-rich stretch increased the affinity of the head domain for the C terminus. Inhibition of phosphatases with OA altered the binding of H2 to ΔH but had no effect on the H1S mutant.
Figure 2.
Figure 2.
Mapping of critical residues located in the third serine-rich region of CLIP-170. (A) Sequence alignment of the third serine-rich region of CLIP-170 for human, rat, mouse and chicken. Conserved serine residues are highlighted in red. * - residues identical in all sequences in the alignment; : - conservative substitutions; . - semiconservative substitutions. (B) Representative images of 3T3 NIH fibroblasts expressing either YFP-CLIP-170 or its mutants. Images were collected using the same setting for each channel between experiments. YFP-CLIP-170 does not bind stabilized MTs in Taxol-treated cells. Mutation of serines 309, 311, 313, 319, 320, and 347 to alanines resulted in binding of mutants to Taxol MTs. Mutation of the same residues to glutamic acid (except for S347E) did not cause binding to stabilized MTs (shown for YFP-CLIP-170-E309, 311). In the overlay GFP is green and tubulin is red. Bar, 10 μm. (C) Relative expression levels of different CLIP-170 mutants presented as a ratio of integrated intensity of GFP/tubulin in the whole cell. Each data point represents a cell. Cells exhibiting ratios within the range of 0.5–1.5 were selected for further analysis. (D) Colocalization of CLIP-170 mutants with stabilized MTs was analyzed using the same set of cells as represented in C. Colocalization coefficients were calculated from the scatter plots for GFP and tubulin using LSM software and Z-stack images (Carl Zeiss MicroImaging Inc, Jena, Germany). Each data point represents a cell. The black lines in C and D indicate the average values.
Figure 3.
Figure 3.
Identification of serine residues affecting intramolecular association and conformational changes in CLIP-170. (A) CoIP of HA-ΔH with GFP-H2 mutants. Lysates were prepared from COS-1 cells transiently coexpressing the indicated GFP-H2 mutants together with ΔH; immunoprecipitation was performed with anti-GFP mAb. Western blots were probed with anti-HA to detect bound ΔH and with anti-GFP antibodies to detect the H2 mutants. The relative expression level of exogenous proteins is shown below, 3% of the whole cell extracts of the “input” samples used for coIP. The bar plot represents the relative amounts of coimmunoprecipitated ΔH (normalized to IP GFP-H2). The amount of ΔH coIP with H1S mutant was assigned as 100%. Mean ± SD was determined from three independent experiments. (B) FRET analysis of YFP-CLIP-170-CFP fusion and its mutants. Five serine residues at positions 309, 311, 313, 319, and 320 were substituted either with alanine (A-5) or with glutamic acid (E-5). Uncorrected emission spectra of cell extracts measured with the excitation at 425 nm. Fluorescence intensity is shown in arbitrary units. FRET signal of the equimolar mixture of YFP and CFP (negative control) is shown in each graph for comparison. (C) Ratios of emission at 527 nm (YFP acceptor) to 475 nm (CFP donor). Mean ± SD was determined from three independent measurements.
Figure 4.
Figure 4.
Effects of CLIP-170 mutations on binding to MT lattice and MT tips. (A) MT pelleting assays with YFP-CLIP-170, A-5, and E-5 mutants. The assays were performed with cell extracts prepared from COS-1 cells expressing YFP-CLIP-170 or its mutants. Concentrations of added Taxol MTs varied from 0 to 8 μM as indicated. Western blots were probed with anti-GFP mAb; tubulin was detected by silver staining. S, supernatant; P, pellet. (B) The amount of protein bound to Taxol MTs was estimated based on densitometry analysis of immunoblots (sum of protein in supernatant and pellet was taken for 100%) and plotted versus the concentration of added Taxol MTs. The best fit to the data demonstrated the difference in affinity of A-5 and E-5 to Taxol MTs. (C–G) Binding of YFP-CLIP-170 and its mutants to the MT tips. (C) Representative live images of CHO-K1 cells expressing YFP-CLIP-170, A-5, and E-5 mutants. (D) Enlarged images from the rectangular boxes in C. Bar, 5 μm. (E) Distribution of CLIP-170 and mutants at the MT tips. The length of YFP-positive structures was plotted versus the average intensity of YFP signal at the MT ends. Each data point represents an individual MT end; n = 300 MTs in 30 cells (∼10 MTs/cell) were analyzed for each mutation. (F) The plots show fluorescent intensity decay at the MT tips over time (average of 40 MTs ± SE). The images were collected using the stream mode of MetaMorph software and 100-ms exposure time. Images were utilized for kymograph analysis after background subtraction. The intensity decay at the distal MT ends was measured within 1 pixel using linescan analysis. The digital data were used to recalculate each data point and to normalize maximum value to 60 arbitrary units (a.u.). The data originated from analysis of 40 MT ends were averaged and plotted as a scatter plot with the error bar. Each data point represents the fluorescence intensity at the MT end over time for 40 MTs. The exponential curve fitting was used to determine the decay constant, kd (line plot on the graph). (G) Fast FRAP analysis of YFP-CLIP-170 and A-5 mutant in COS cells. Fluorescence intensity over time was measured along the lines of a 3-pixel width (200 nm) and a 250-pixel length (∼7.5 s), starting 25 pixels (i.e., ∼750 ms) before the bleaching. Mean fluorescence decay in nonbleached areas (blue; 14 measurements for YFP-CLIP-170 and 12 for A-5) and recovery in bleach areas (red; 18 FRAP curves for YFP-CLIP-170 and 31 for A-5) after photobleaching. Mean fluorescence recovery on MT ends (k) is indicated. Details of FRAP analysis are provided in Supplemental Figure 3.
Figure 4.
Figure 4.
Effects of CLIP-170 mutations on binding to MT lattice and MT tips. (A) MT pelleting assays with YFP-CLIP-170, A-5, and E-5 mutants. The assays were performed with cell extracts prepared from COS-1 cells expressing YFP-CLIP-170 or its mutants. Concentrations of added Taxol MTs varied from 0 to 8 μM as indicated. Western blots were probed with anti-GFP mAb; tubulin was detected by silver staining. S, supernatant; P, pellet. (B) The amount of protein bound to Taxol MTs was estimated based on densitometry analysis of immunoblots (sum of protein in supernatant and pellet was taken for 100%) and plotted versus the concentration of added Taxol MTs. The best fit to the data demonstrated the difference in affinity of A-5 and E-5 to Taxol MTs. (C–G) Binding of YFP-CLIP-170 and its mutants to the MT tips. (C) Representative live images of CHO-K1 cells expressing YFP-CLIP-170, A-5, and E-5 mutants. (D) Enlarged images from the rectangular boxes in C. Bar, 5 μm. (E) Distribution of CLIP-170 and mutants at the MT tips. The length of YFP-positive structures was plotted versus the average intensity of YFP signal at the MT ends. Each data point represents an individual MT end; n = 300 MTs in 30 cells (∼10 MTs/cell) were analyzed for each mutation. (F) The plots show fluorescent intensity decay at the MT tips over time (average of 40 MTs ± SE). The images were collected using the stream mode of MetaMorph software and 100-ms exposure time. Images were utilized for kymograph analysis after background subtraction. The intensity decay at the distal MT ends was measured within 1 pixel using linescan analysis. The digital data were used to recalculate each data point and to normalize maximum value to 60 arbitrary units (a.u.). The data originated from analysis of 40 MT ends were averaged and plotted as a scatter plot with the error bar. Each data point represents the fluorescence intensity at the MT end over time for 40 MTs. The exponential curve fitting was used to determine the decay constant, kd (line plot on the graph). (G) Fast FRAP analysis of YFP-CLIP-170 and A-5 mutant in COS cells. Fluorescence intensity over time was measured along the lines of a 3-pixel width (200 nm) and a 250-pixel length (∼7.5 s), starting 25 pixels (i.e., ∼750 ms) before the bleaching. Mean fluorescence decay in nonbleached areas (blue; 14 measurements for YFP-CLIP-170 and 12 for A-5) and recovery in bleach areas (red; 18 FRAP curves for YFP-CLIP-170 and 31 for A-5) after photobleaching. Mean fluorescence recovery on MT ends (k) is indicated. Details of FRAP analysis are provided in Supplemental Figure 3.
Figure 5.
Figure 5.
Dephosphorylation site mutations increases affinity of CLIP-170 for dynactin and delays Golgi reassembly. (A–C) The distribution of dynactin at MT tips in cells depleted of CLIP-170 and re-expressing CLIP-170 mutants. CHO-K1 cells expressing CFP-tagged shRNA to CLIP-170 and either YFP-CLIP-170 (A) and A-5 (B) or E-5 (C) mutants (blue in overlay) were stained for p50 (red) and tubulin (green). Enlarged images of control (1) or expressing (2) cells are shown from the right. Bar, 5 μm. (D–G) Fluorescence intensity profiles for p50 (red); YFP (blue) and tubulin (green) at the distal MT ends in nontransfected cells (D); cells expressing YFP-CLIP-170 (E), A-5 (F), or E-5 (G) mutants. The average intensity of 20 MTs ± SE. (H) The accumulation of p50 at the MT tips relative to expression of CLIP-170 or mutants. The integrated intensity of p50 was expressed as a percentage of the intensity in control cells from the same image, which was taken for 100% and plotted as box graphs. The boundaries of the box and whiskers indicate the 25th and the 75th percentile, and the 90th and 10th percentiles, respectively. The median and mean are shown by a straight and a dotted line, respectively. The numbers on the graphs indicate the average values and standard deviations. The values are statistically different with 95% confidence of nonoverlapping intervals. (I) Dephosphorylation site mutations increase affinity of CLIP-170 for p150Glued. Lysates prepared from COS-1 cells expressing GFP (1), YFP-CLIP-170 (2), A-5 (3), or E-5 (4) were used for IPs with anti-GFP antibodies. Resulting precipitates were probed with antibodies against GFP and p150Glued. Arrowheads indicate GFP and YFP-CLIP-170 bands; additionally detected bands result from cross-reaction with immunoglobulin G heavy chain. (J) Time course of Golgi reassembly after nocodazole-induced scattering. CHO-K1 cells coexpressing CFP-GalT and YFP-CLIP-170 mutants were used to score percentages of cells with reassembled Golgi at the different times after nocodazole washout. Cells expressing only CFP-GalT were used as a control. Cells expressing YFP-CLIP-170A-5 display significant delay in Golgi reassembly.
Figure 6.
Figure 6.
PKA regulates CLIP-170 intramolecular interaction and binding to MTs. (A) Predicted kinase-specific phosphorylation sites in the third serine region of CLIP-170. Amino acids 302-322 from rat CLIP-170 are shown. S309 is a predicted Glycogen synthase kinase (GSK)-3 and cdk5 site, S311 is a RSK and PKA site, S313 is CK1 site, S319 is GSK-3 and cdc2 site, and S320is PKC site. Critical serine residues are in gray; noncritical residues are in green; numbers indicate phosphorylation scores. (B) Effect of PKA activation (forskolin) and inhibition (H-89) on CLIP-170 intramolecular interaction. COS-1 cells coexpressing GFP-H2 and HA-ΔH domains of CLIP-170 were treated with dimethyl sulfoxide (DMSO), 40 μM forskolin, or 0.2 μM H-89. Cell lysates were used for IPs with anti-GFP antibodies, and resulting precipitates were probed with antibodies against HA and GFP. Activation of PKA increases the amount of coprecipitated ΔH domain, whereas inhibition abolishes this interaction. (C) PKA modulates CLIP-170 binding to MTs in cells. CHO-K1 cells expressing YFP-CLIP-170 were treated with 200 nM H-89 and 10 mg/ml Taxol for 2 h; 40 μM forskolin or 20 μM forskolin and 100 nM okadaic acid (forskolin + OA) or 1 μM okadaic acid (OA) for 1 h. Cells were fixed and stained for YFP (red in overlay), tubulin (green), and DNA (4,6-diamidino-2-phenylindole [DAPI]; blue). Bar, 10 μm. (D) The binding of YFP-CLIP-170 to Taxol-stabilized MTs in cells pretreated with DMSO and H-89. Relative intensity and colocalization coefficient were quantified as described in Figure 2. Inhibition of PKA led to the binding of CLIP-170 to MTs in Taxol-treated cells. (E–G) Histograms of distributions of the YFP-CLIP-170–positive MT tip lengths in cells treated with forskolin (E), forskolin + OA (F), and OA (G). Mean ± SD is indicated in the corner of each graph. n = 150 MTs for each condition.
Figure 7.
Figure 7.
Model of phosphorylation-mediated autoinhibition of CLIP-170. CLIP-170 consists of two CAP-Gly domains surrounded by three serine-rich regions at N terminus; coiled-coil and two zinc-knuckles at the C terminus. Dephosphorylated CLIP-170 possesses open conformation and binds to MT tips and dynactin with high affinity. Phosphorylation of CLIP-170 on serine residues located in the third serine-rich region induces CLIP-170 conformational changes resulting in CLIP-170 autoinhibition. CLIP-170 possessing folded conformation exhibits low affinity to MT tips and dynactin.

References

    1. Akhmanova A., et al. Clasps are CLIP-115 and -170 associating proteins involved in the regional regulation of microtubule dynamics in motile fibroblasts. Cell. 2001;104:923–935. - PubMed
    1. Akhmanova A., et al. The microtubule plus-end-tracking protein CLIP-170 associates with the spermatid manchette and is essential for spermatogenesis. Genes Dev. 2005;19:2501–2515. - PMC - PubMed
    1. Akhmanova A., Steinmetz M. O. Tracking the ends: a dynamic protein network controls the fate of microtubule tips. Nat. Rev. Mol. Cell Biol. 2008;9:309–322. - PubMed
    1. Arnal I., Heichette C., Diamantopoulos G. S., Chretien D. CLIP-170/tubulin-curved oligomers coassemble at microtubule ends and promote rescues. Curr. Biol. 2004;14:2086–2095. - PubMed
    1. Beausoleil S. A., Villen J., Gerber S. A., Rush J., Gygi S. P. A probability-based approach for high-throughput protein phosphorylation analysis and site localization. Nat. Biotechnol. 2006;24:1285–1292. - PubMed

Publication types

MeSH terms

LinkOut - more resources