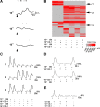
Distinct signals conveyed by pheromone concentrations to the mouse vomeronasal organ
- PMID: 20519522
- PMCID: PMC2919682
- DOI: 10.1523/JNEUROSCI.0825-10.2010
Distinct signals conveyed by pheromone concentrations to the mouse vomeronasal organ
Abstract
In mammalian species, detection of pheromone cues by the vomeronasal organ (VNO) at different concentrations can elicit distinct behavioral responses and endocrine changes. It is not well understood how concentration-dependent activation of the VNO impacts innate behaviors. In this study, we find that, when mice investigate the urogenital areas of a conspecific animal, the urinary pheromones can reach the VNO at a concentration of approximately 1% of that in urine. At this level, urinary pheromones elicit responses from a subset of cells that are tuned to sex-specific cues and provide unambiguous identification of the sex and strain of animals. In contrast, low concentrations of urine do not activate these cells. Strikingly, we find a population of neurons that is only activated by low concentrations of urine. The properties of these neurons are not found in neurons responding to putative single-compound pheromones. Additional analyses show that these neurons are masked by high-concentration pheromones. Thus, an antagonistic interaction in natural pheromones results in the activation of distinct populations of cells at different concentrations. The differential activation is likely to trigger different downstream circuitry and underlies the concentration-dependent pheromone perception.
Figures


Similar articles
-
Imaging neuronal responses in slice preparations of vomeronasal organ expressing a genetically encoded calcium sensor.J Vis Exp. 2011 Dec 6;(58):3404. doi: 10.3791/3404. J Vis Exp. 2011. PMID: 22157702 Free PMC article.
-
Encoding gender and individual information in the mouse vomeronasal organ.Science. 2008 Apr 25;320(5875):535-8. doi: 10.1126/science.1154476. Science. 2008. PMID: 18436787 Free PMC article.
-
Identification of protein pheromones that promote aggressive behaviour.Nature. 2007 Dec 6;450(7171):899-902. doi: 10.1038/nature05997. Nature. 2007. PMID: 18064011
-
Electrophysiological and biochemical responses of mouse vomeronasal receptor cells to urine-derived compounds: possible mechanism of action.Chem Senses. 1998 Aug;23(4):483-9. doi: 10.1093/chemse/23.4.483. Chem Senses. 1998. PMID: 9759537 Review.
-
Pheromone detection by mammalian vomeronasal neurons.Microsc Res Tech. 2002 Aug 1;58(3):251-60. doi: 10.1002/jemt.10152. Microsc Res Tech. 2002. PMID: 12203702 Review.
Cited by
-
Calcium imaging of vomeronasal organ response using slice preparations from transgenic mice expressing G-CaMP2.Methods Mol Biol. 2013;1068:211-20. doi: 10.1007/978-1-62703-619-1_15. Methods Mol Biol. 2013. PMID: 24014364 Free PMC article.
-
The neural circuits of mating and fighting in male mice.Curr Opin Neurobiol. 2016 Jun;38:27-37. doi: 10.1016/j.conb.2016.01.006. Epub 2016 Feb 3. Curr Opin Neurobiol. 2016. PMID: 26849838 Free PMC article. Review.
-
Experience-Dependent Plasticity Drives Individual Differences in Pheromone-Sensing Neurons.Neuron. 2016 Aug 17;91(4):878-892. doi: 10.1016/j.neuron.2016.07.034. Neuron. 2016. PMID: 27537487 Free PMC article.
-
TRICK or TRP? What Trpc2(-/-) mice tell us about vomeronasal organ mediated innate behaviors.Front Neurosci. 2015 Jun 23;9:221. doi: 10.3389/fnins.2015.00221. eCollection 2015. Front Neurosci. 2015. PMID: 26157356 Free PMC article.
-
An excreted small molecule promotes C. elegans reproductive development and aging.Nat Chem Biol. 2019 Aug;15(8):838-845. doi: 10.1038/s41589-019-0321-7. Epub 2019 Jul 18. Nat Chem Biol. 2019. PMID: 31320757 Free PMC article.
References
-
- Beauchamp GK, Martin IG, Wysocki CJ, Wellington JL. Chemoinvestigatory and sexual behavior of male guinea pigs following vomeronasal organ removal. Physiol Behav. 1982;29:329–336. - PubMed
-
- Belluscio L, Koentges G, Axel R, Dulac C. A map of pheromone receptor activation in the mammalian brain. Cell. 1999;97:209–220. - PubMed
-
- Beynon RJ, Hurst JL. Multiple roles of major urinary proteins in the house mouse, Mus domesticus. Biochem Soc Trans. 2003;31:142–146. - PubMed
-
- Birch MC. Pheromones. New York: American Elsevier; 1974.
-
- Blake R, Logothetis NK. Visual competition. Nat Rev Neurosci. 2002;3:13–21. - PubMed
Publication types
MeSH terms
Substances
Grants and funding
LinkOut - more resources
Full Text Sources
Other Literature Sources
