. 2010 Jun 2;30(22):7587-97.
doi: 10.1523/JNEUROSCI.0389-10.2010.

Onset coding is degraded in auditory nerve fibers from mutant mice lacking synaptic ribbons

Affiliations

Onset coding is degraded in auditory nerve fibers from mutant mice lacking synaptic ribbons

Bradley N Buran et al. J Neurosci. .

Erratum in

  • J Neurosci. 2012 Apr 18;32(16):5704

Abstract

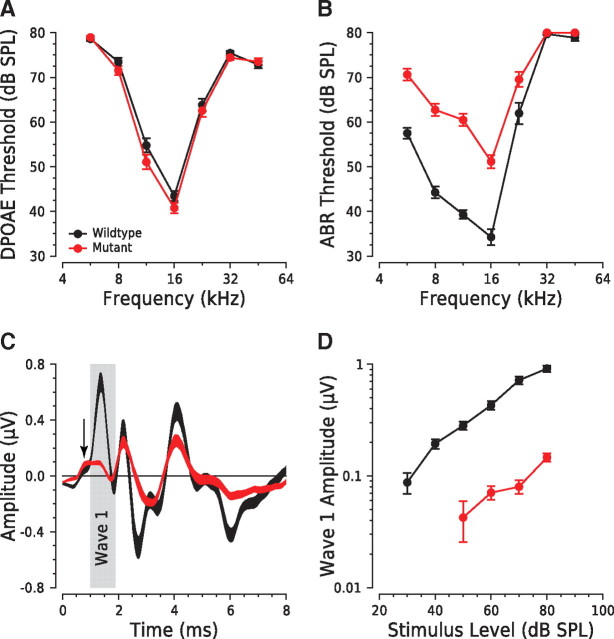
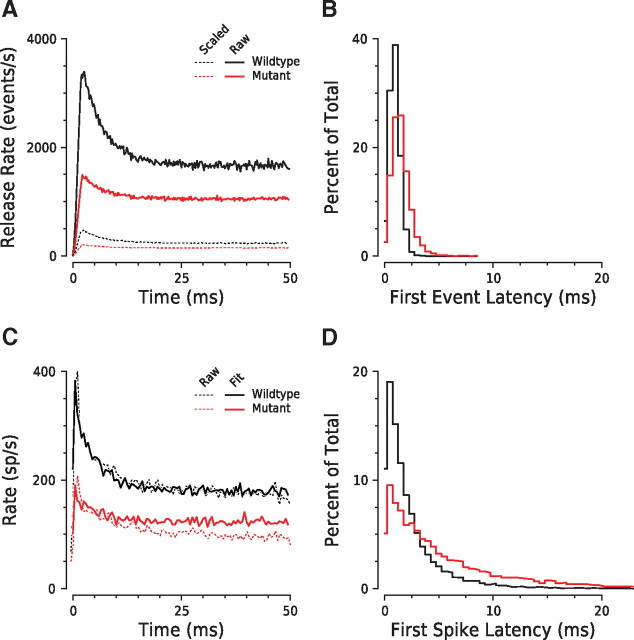
Synaptic ribbons, found at the presynaptic membrane of sensory cells in both ear and eye, have been implicated in the vesicle-pool dynamics of synaptic transmission. To elucidate ribbon function, we characterized the response properties of single auditory nerve fibers in mice lacking Bassoon, a scaffolding protein involved in anchoring ribbons to the membrane. In bassoon mutants, immunohistochemistry showed that fewer than 3% of the hair cells' afferent synapses retained anchored ribbons. Auditory nerve fibers from mutants had normal threshold, dynamic range, and postonset adaptation in response to tone bursts, and they were able to phase lock with normal precision to amplitude-modulated tones. However, spontaneous and sound-evoked discharge rates were reduced, and the reliability of spikes, particularly at stimulus onset, was significantly degraded as shown by an increased variance of first-spike latencies. Modeling based on in vitro studies of normal and mutant hair cells links these findings to reduced release rates at the synapse. The degradation of response reliability in these mutants suggests that the ribbon and/or Bassoon normally facilitate high rates of exocytosis and that its absence significantly compromises the temporal resolving power of the auditory system.


Figures

Figure 1.
Figure 1.
Synaptic ribbons in mutant IHCs are greatly reduced in number. A, Schematic of an IHC with a subset (3) of its typical complement (∼20) of AN fibers. B, Ribbon counts from four mutant and two wild-type ears, based on confocal analysis of cochlear whole mounts such as those in E and F. C, D, Electron micrograph (C) of a hair cell ribbon synapse in cat and an accompanying schematic (D) indicating the locations of key synaptic structures. E, F, Confocal projections of IHCs from the 16 kHz place in mutant and wild-type mice, immunostained with the synaptic ribbon marker α-CtBP2 (red) and an IHC marker, α-calretinin (green). Dashed lines indicate outlines of the IHCs.
Figure 2.
Figure 2.
A–D, Otoacoustic emissions are normal in mutants (A), whereas ABRs are reduced (B, C, D), consistent with impaired synaptic transmission. A, Mean DPOAE thresholds for mutant versus wild-type ears (n = 70 of each genotype). B, Mean ABR thresholds for mutants (n = 53) versus wild types (n = 50). C, Mean ABR waveforms from responses to 16 kHz tone pips at 80 dB SPL from mutants (n = 53) versus wild types (n = 50). D, Mean amplitude versus level functions for ABR wave 1 from wild types (n = 48) versus mutants (n = 57) from responses to 16 kHz pips. The color key in A applies to all panels. Error bars (A, B, D) or trace thickness (C) indicate ± SEM.
Figure 3.
Figure 3.
A–C, SR is reduced in mutant AN fibers (A, B); however, spike discharge remains irregular (C). A, SR as a function of characteristic frequency for all AN fibers sampled. B, Frequency distribution showing the fraction of fibers with SRs in different ranges (bin width, 10 spikes/s). C, Interspike interval histograms of spontaneous activity from all fibers with SR between 40 and 50 spikes per second: these histograms are normalized by the total spike count to reflect an estimate of the probability density function (bin width, 0.5 ms).
Figure 4.
Figure 4.
The sound-evoked rate is reduced in mutant AN fibers, particularly for rapid stimulus onsets. A, Mean poststimulus onset time (PST) histograms from responses to 50 ms tone bursts (2.5 ms rise–fall) at the characteristic frequency, 30 dB from threshold. To maintain onset responses, each histogram was shifted, before averaging, to align its peak with the mean latency for the genotype. To compare the postonset adaptation, each averaged histogram was fit to an exponential with two time constants (thick lines above histograms). B, Mean PST histograms for mutant versus wild-type AN fibers in response to 50 μs clicks at 30 dB from threshold; latencies are adjusted as described above. C, Mean onset rates for mutant versus wild-type AN fibers for clicks, tone bursts (2.5 ms rise–fall times), and tone pips of the type used to evoke an ABR (0.4 ms rise–fall times), as assessed with PST histograms with a 0.1 ms bin width. D, E, Relationship between SR and peak (D) or adapted (E) rate for all AN fibers. The peak rate is the maximum instantaneous rate seen with a bin width of 0.5 ms, whereas adapted rate is averaged over poststimulus onset times of 35–45 ms.
Figure 5.
Figure 5.
Analysis of first-spike latencies (FSLs) demonstrates the loss of reliable AN response in mutant ears. A, Dot raster plots show spike times (small gray dots) from a representative wild-type and mutant AN fiber for multiple repetitions of a 50 ms tone burst: for each repetition, the time of the first spike is highlighted by the large black (wild type) or red (mutant) symbol. B, Histograms of FSLs for representative wild-type and mutant fibers of comparative spontaneous rate and characteristic frequency as computed from data such as those in A. C, Relationship between SR and FSL variance for all AN fibers sampled.
Figure 6.
Figure 6.
Analysis of synchronization index reveals that temporal precision of AN response is not degraded in mutant ears. A, As in Figure 5, dot raster plots show spike times for a representative wild-type (black) and mutant (red) AN fiber in response to multiple repetitions of a transposed tone (modulation frequency set to 500 Hz, carrier frequency set to fiber CF). B, Mean interspike interval histograms for mutant versus wild-type AN fibers responding to transposed tones such as those in A. Intervals are expressed as a fraction of the modulation period. Data from fibers of each genotype are pooled before computing the histogram. Counts are divided by the bin width (0.01 of the period) and number of repetitions to represent the probability of discharge in a given interval. C, Sample post-zero-crossing histograms for representative wild-type (i.e., high SR) and mutant (i.e., low SR) fibers show the degree of synchrony between spike times and the modulation period: histograms such as these are used to compute the synchronization index shown in D. D, Maximum synchronization index as a function of modulation frequency for mutant versus wild-type AN responses to transposed tones with carrier frequency at the CF (box–whisker plots show the first, 25th, 50th, 75th, and 99th quantiles). The maximum SI is determined for each fiber by sweeping transposed tones in 5 dB steps from threshold to ∼40 dB from threshold.
Figure 7.
Figure 7.
Reduced presynaptic release rate can account for degraded reliability of spike onset coding in mutant fibers. A, Mean vesicle release rates for wild-type and mutant synapses, derived from IHC capacitance recordings at 8 weeks. Dashed lines (inferred release rates downscaled to approximately one-eighth) represent the “effective” rates of excitatory input to the AN fiber, assuming the same presynaptic coordination of release (μ = 1.6) (Neef et al., 2007) and the same postsynaptic detection threshold (average of 2 synaptic vesicles). B, Latency distributions for first release events extracted from capacitance records of wild-type and mutant IHCs. C, Poststimulus time histograms of simulated and measured spike rates in response to tone bursts. Simulated rates were obtained from convolving the “effective” rate of excitatory input with the refractoriness function. Since capacitance measures were from apical IHCs (Khimich et al., 2005), AN rates are mean data from fibers with a CF of ≤10 kHz, i.e., fibers originating from the apical turn. The simulated histograms were shifted in time so that the peak rates matched those of the recorded data. D, Simulated first-spike latency distributions show the experimentally observed broadening in mutant fibers.

References

    1. Altrock WD, tom Dieck S, Sokolov M, Meyer AC, Sigler A, Brakebusch C, Fässler R, Richter K, Boeckers TM, Potschka H, Brandt C, Löscher W, Grimberg D, Dresbach T, Hempelmann A, Hassan H, Balschun D, Frey JU, Brandstätter JH, Garner CC, et al. Functional inactivation of a fraction of excitatory synapses in mice deficient for the active zone protein bassoon. Neuron. 2003;37:787–800. - PubMed
    1. Batra R, Kuwada S, Fitzpatrick DC. Sensitivity to interaural temporal disparities of low- and high-frequency neurons in the superior olivary complex. I. Heterogeneity of responses. J Neurophysiol. 1997;78:1222–1236. - PubMed
    1. Bernstein LR, Trahiotis C. Enhancing sensitivity to interaural delays at high frequencies by using “transposed stimuli.”. J Acoust Soc Am. 2002;112:1026–1036. - PubMed
    1. Berry MJ, Meister M. Refractoriness and neural precision. J Neurosci. 1998;18:2200–2211. - PMC - PubMed
    1. Beutner D, Voets T, Neher E, Moser T. Calcium dependence of exocytosis and endocytosis at the cochlear inner hair cell afferent synapse. Neuron. 2001;29:681–690. - PubMed

Publication types

MeSH terms