. 2010 Jun 2;30(22):7604-12.
doi: 10.1523/JNEUROSCI.0296-10.2010.

Cortical representation of natural complex sounds: effects of acoustic features and auditory object category

Affiliations

Cortical representation of natural complex sounds: effects of acoustic features and auditory object category

Amber M Leaver et al. J Neurosci. .

Abstract

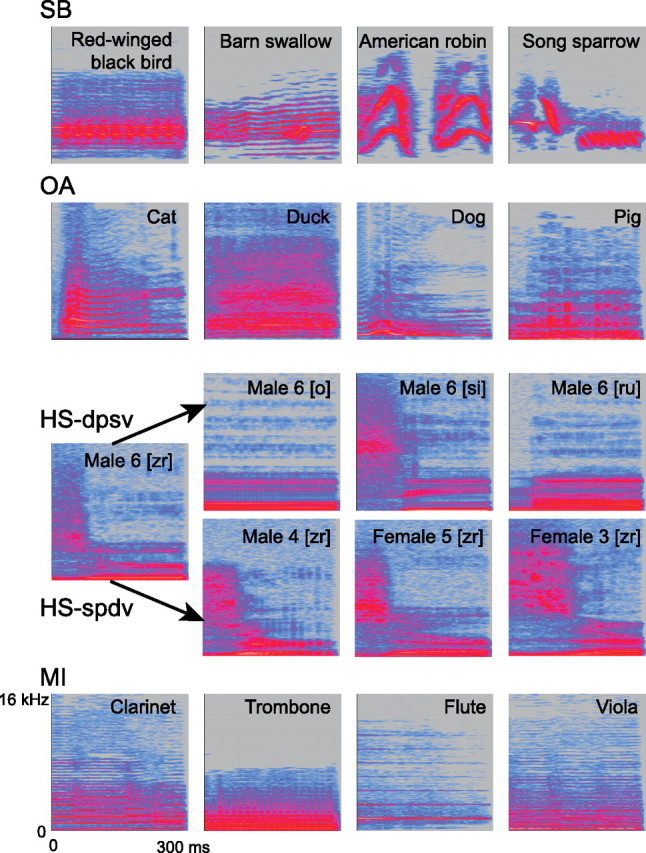
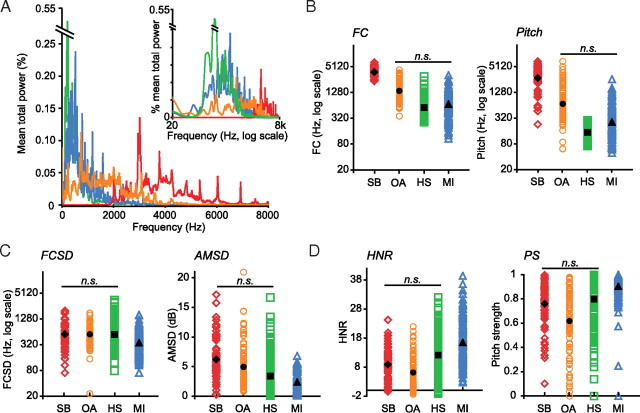
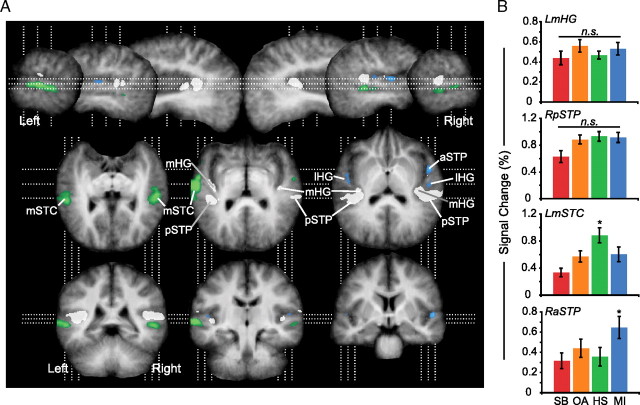
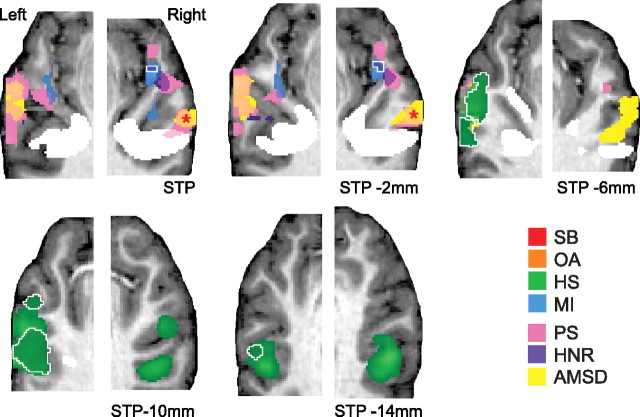
How the brain processes complex sounds, like voices or musical instrument sounds, is currently not well understood. The features comprising the acoustic profiles of such sounds are thought to be represented by neurons responding to increasing degrees of complexity throughout auditory cortex, with complete auditory "objects" encoded by neurons (or small networks of neurons) in anterior superior temporal regions. Although specialized voice and speech-sound regions have been proposed, it is unclear how other types of complex natural sounds are processed within this object-processing pathway. Using functional magnetic resonance imaging, we sought to demonstrate spatially distinct patterns of category-selective activity in human auditory cortex, independent of semantic content and low-level acoustic features. Category-selective responses were identified in anterior superior temporal regions, consisting of clusters selective for musical instrument sounds and for human speech. An additional subregion was identified that was particularly selective for the acoustic-phonetic content of speech. In contrast, regions along the superior temporal plane closer to primary auditory cortex were not selective for stimulus category, responding instead to specific acoustic features embedded in natural sounds, such as spectral structure and temporal modulation. Our results support a hierarchical organization of the anteroventral auditory-processing stream, with the most anterior regions representing the complete acoustic signature of auditory objects.


Figures

Figure 1.
Figure 1.
Example stimulus spectrograms for each category. Each row of four spectrograms represents an example trial. On each trial, four stimuli were presented, all from the same category (SBs, OAs, HS; HS-dvsp, HS-svdp, or MIs). Each stimulus was 300 ms in duration, as indicated by the length of the x-axis of the spectrograms. Frequency is plotted along the y-axis (0–16 kHz, linear scale), and stimulus intensity is denoted by color (grays and blues indicate low amplitude, pinks indicate high amplitude in dB).
Figure 2.
Figure 2.
Acoustic features as a function of stimulus category. A, Mean power spectra are plotted for each stimulus category (SBs, red; OAs, orange; HS, green; MIs, blue; color scheme remains consistent throughout). Frequency is plotted in linear scale on the x-axis, while intensity is plotted on the y-axis. Mean power spectra are plotted again in the inset, with frequency shown in log scale along the x-axis, which better approximates the perceptual distances between frequencies in humans. B, Spectral content. FC (left) and pitch (right) are plotted in color for each stimulus; mean values are in black. y-axes are plotted in log scale. C, Temporal variability. FCSD values (left) and AMSD values (right) are plotted as in B. D, Spectral structure. HNR (left) and PS (right) are plotted as in B and C.
Figure 3.
Figure 3.
Category-selective regions of auditory cortex. A, Group functional maps are overlaid on group-averaged anatomical images, rotated to visualize the superior temporal plane in oblique horizontal sections. Category-selective voxels are shown in color: green clusters indicate regions selectively responsive to human speech sounds; blue indicates clusters selective for musical instrument sounds. No voxels were selective for songbird or other animal sounds. Significant category-selective voxels reflect the results of independent conjunction analyses, identifying areas significantly greater for each category than each remaining category (p(corr) < 0.05). White voxels were significantly active for all four stimulus categories (t(14) > 3.79, p(uncorr) < 0.005) but demonstrated no significant differences between pairwise comparisons of category (p(corr) > 0.05). Sagittal sections are 10 mm apart within each hemisphere (top row). Oblique horizontal images (middle) are 7 mm apart and are arranged from inferior (left) to superior (right). Coronal sections (bottom) are 17 mm apart and arranged from posterior to anterior. B, Signal is plotted for representative functional voxels from clusters that exhibited no significant difference (n.s.) in response across categories (mHG, pSTP) and two category-selective clusters (speech, LmSTC; music, RaSTP).
Figure 4.
Figure 4.
Sensitivity to acoustic features in auditory cortex. Group functional maps from the standard (Fig. 3) and combined models are overlaid on anatomical images from a single representative subject, rotated to visualize STP. The combined model included both stimulus category and acoustic features (FC, PS, HNR, FCSD, and AMSD) as model regressors. Category-selective voxels from the standard model are shown in light green (HS) and light blue (HS). Remaining category-selective voxels identified with the combined model (i.e., after statistically controlling for the acoustic feature effects) are depicted in dark green (HS) and dark blue (MI) and encircled in white. Clusters exhibited significant relationships with acoustic features, including PS (pink), HNR (purple), and AMSD (yellow). The asterisk marks the cluster exhibiting a significant parametric relationship with AMSD in both combined models (see Materials and Methods) (supplemental Table 3, available at www.jneurosci.org as supplemental material). White voxels are marked as in Figure 3.
Figure 5.
Figure 5.
Subregion of left superior temporal sulcus selective for acoustic–phonetic content of human speech sounds. A, A “masked” analysis restricted to regions identified as HS selective (green) demonstrated an anterior subregion of LmSTS (white) that was selective for the acoustic–phonetic content of human speech stimuli. The mask was defined (and subsequent analysis was performed) using the combined analysis with both trial category and acoustic features considered (p(corr) < 0.001; both models yielded similar results) (see Materials and Methods). Group data are overlaid on anatomical images from a representative single subject. B, The ROI in A was identified as phoneme selective using fMRI-RA; the signal associated with trials in which acoustic–phonetic content was the same (white) was significantly lower than that in trials in which acoustic–phonetic content was varied (gray). The mean ROI signal is depicted here for illustrative purposes only; asterisk indicates significance for voxelwise statistics in A. Error bars indicate SEM.

References

    1. Ahveninen J, Jääskeläinen IP, Raij T, Bonmassar G, Devore S, Hämäläinen M, Levänen S, Lin FH, Sams M, Shinn-Cunningham BG, Witzel T, Belliveau JW. Task-modulated “what” and “where” pathways in human auditory cortex. Proc Natl Acad Sci U S A. 2006;103:14608–14613. - PMC - PubMed
    1. Altmann CF, Doehrmann O, Kaiser J. Selectivity for animal vocalizations in the human auditory cortex. Cereb Cortex. 2007;17:2601–2608. - PubMed
    1. Belin P, Zatorre RJ. Adaptation to speaker's voice in right anterior temporal lobe. Neuroreport. 2003;14:2105–2109. - PubMed
    1. Belin P, Zatorre RJ, Lafaille P, Ahad P, Pike B. Voice-selective areas in human auditory cortex. Nature. 2000;403:309–312. - PubMed
    1. Bendor D, Wang X. The neuronal representation of pitch in primate auditory cortex. Nature. 2005;436:1161–1165. - PMC - PubMed

Publication types

LinkOut - more resources