. 2010 Jun 2;30(22):7714-21.
doi: 10.1523/JNEUROSCI.6427-09.2010.

Visual-haptic adaptation is determined by relative reliability

Affiliations

Visual-haptic adaptation is determined by relative reliability

Johannes Burge et al. J Neurosci. .

Abstract

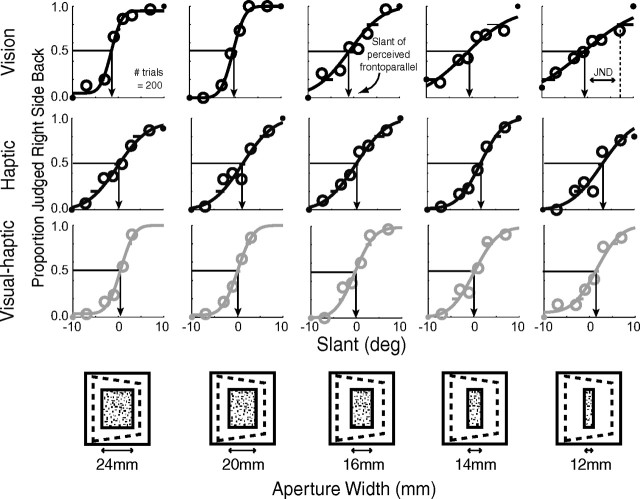
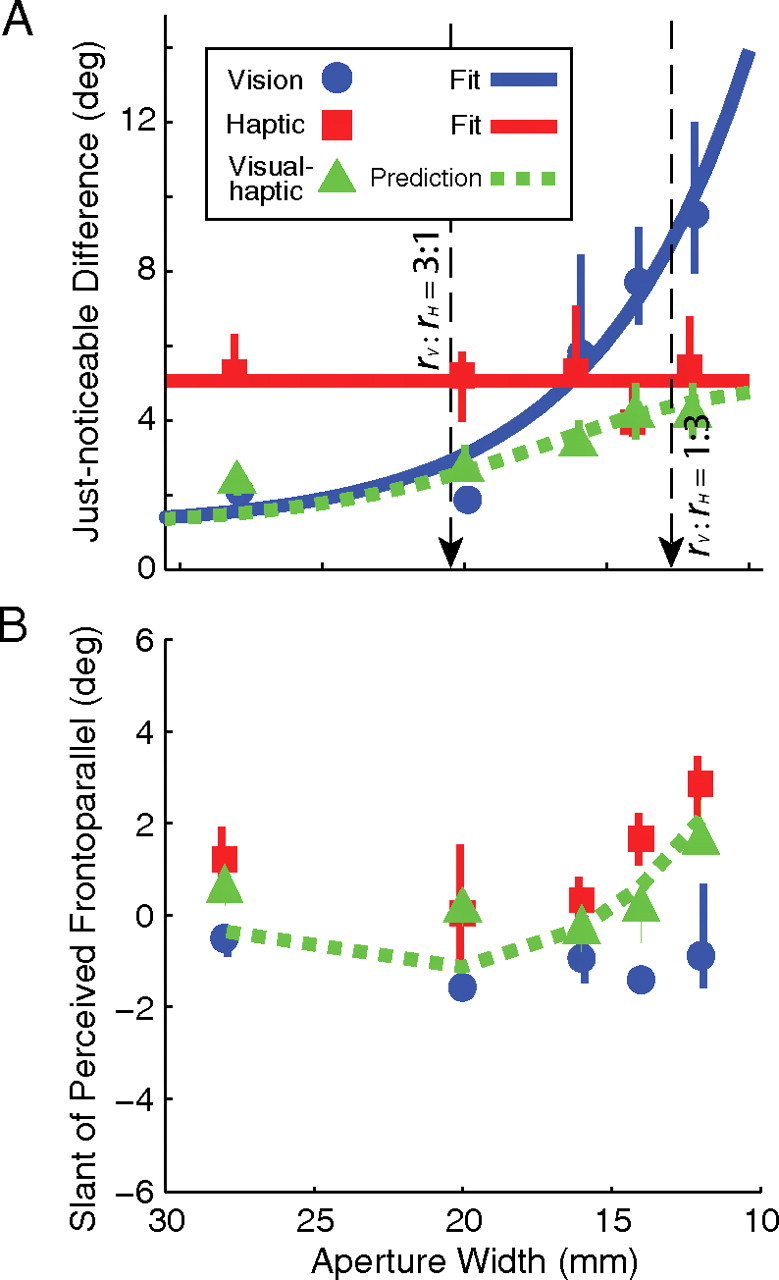
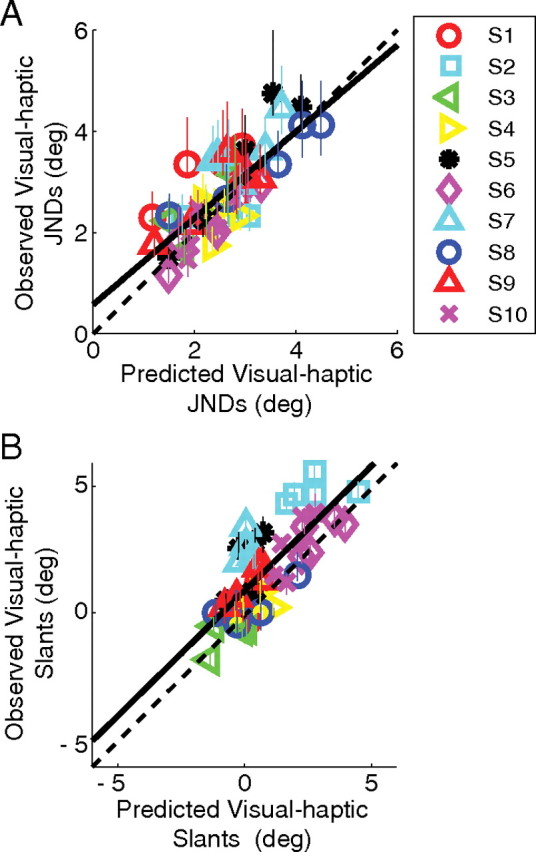
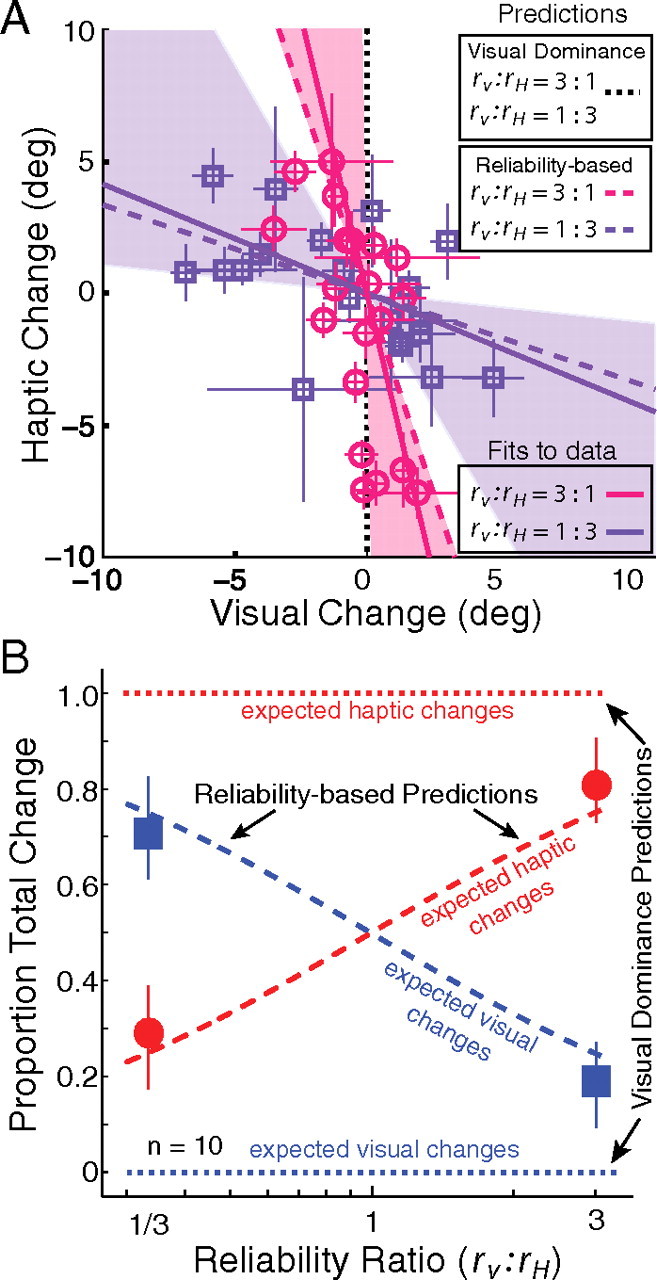
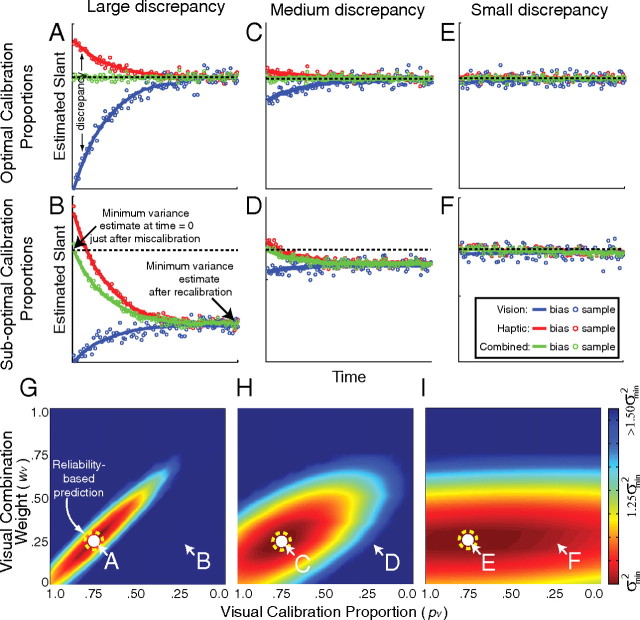
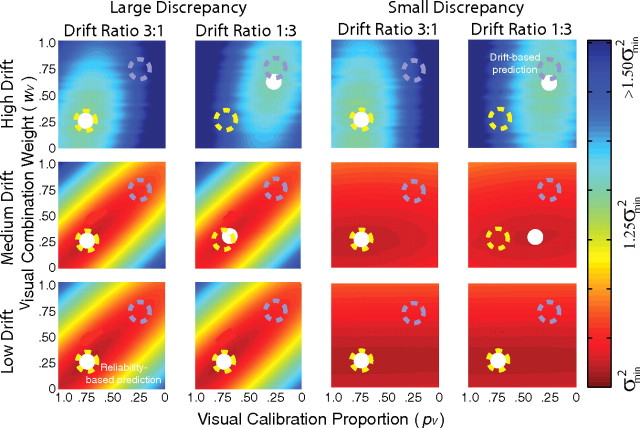
Accurate calibration of sensory estimators is critical for maintaining accurate estimates of the environment. Classically, it was assumed that sensory calibration occurs by one sense changing to become consistent with vision; this is visual dominance. Recently, it has been proposed that changes in estimators occur according to their relative reliabilities; this is the reliability-based model. We show that if cue combination occurs according to relative reliability, then reliability-based calibration assures minimum-variance sensory estimates over time. Recent studies are qualitatively consistent with the reliability-based model, but none have shown that the predictions are quantitatively accurate. We conducted an experiment in which the model could be assessed quantitatively. Subjects indicated whether visual, haptic, and visual-haptic planar surfaces appeared slanted positively or negatively from frontoparallel. In preadaptation, we determined the visual and haptic slants of perceived frontoparallel, and measured visual and haptic reliabilities. We varied visual reliability by adjusting the size of the viewable stimulus. Haptic reliability was fixed. During adaptation, subjects were exposed to visual-haptic surfaces with a discrepancy between the visual and haptic slants. After adaptation, we remeasured the visual and haptic slants of perceived frontoparallel. When vision was more reliable, haptics adapted to match vision. When vision was less reliable, vision adapted to match haptics. Most importantly, the ratio of visual and haptic adaptation was quantitatively predicted by relative reliability. The amount of adaptation of one sensory estimator relative to another depends strongly on the relative reliabilities of the two estimators.


Figures

Figure 1.
Figure 1.
Cue-combination data from one representative subject. Visual-alone, haptic-alone, and visual–haptic psychometric data are shown as a function of aperture width. The proportion of trials in which the slanted plane was perceived as right-side back from frontoparallel is plotted against the slant of the plane for visual-alone (top row), haptic-alone (middle row), and visual–haptic (bottom row) trials. The icons at the bottom depict how the variation of the width of the aperture through which the slanted planes were seen. Arrows indicate the slant that is perceived as frontoparallel. The JND is one SD from perceived frontoparallel; shallower slopes indicate larger JNDs.
Figure 2.
Figure 2.
Cue-combination results for one representative subject. A, Visual-alone slant discrimination thresholds (blue circles) decreased systematically as aperture width increased. As expected, haptic-alone discrimination thresholds (red squares) remained constant with aperture changes. The blue line is an exponential fit to the visual thresholds. The red line is a horizontal line fit to haptic JNDs. The black arrows mark aperture widths for which the ratios of visual and haptic reliabilities are 3:1 and 1:3 (for this subject: 20.5 and 12.6 mm, respectively). The visual–haptic thresholds (green triangles) and the reliability-based prediction for combined thresholds are also shown (green dashed line). The error bars are 95% confidence intervals. B, Visual-alone, haptic-alone, and visual–haptic slants of perceived frontoparallel. The green line is the zero-free-parameter reliability-based prediction of the visual–haptic slants of perceived frontoparallel based on the unimodal thresholds and unimodal slants of perceived frontoparallel. Across subjects, the visual bias was not significantly different from zero (t test, t(9) = −1.43, p = 0.19). The haptic bias was significantly different from zero (t test, t(9), 3.1372, p < 0.012, mean = 2.1°, CI = 0.58–3.59), although the change in bias with aperture size was not significant (ANOVA, F(1,9) = 1.66, p = 0.18). The haptic bias is presumably due to slight differences between the position tracked by the force-feedback device and the actual surface of the finger.
Figure 3.
Figure 3.
Observed versus predicted data for the cue-combination study for all subjects. A, Observed JNDs plotted against predicted JNDs (R2 = 0.603). The solid black line is a linear regression to the data (y = 0.85x + 0.57). B, Slants that were perceived as frontoparallel plotted against the predictions. Subjects performed in a manner consistent with the predictions (R2 = 0.605). The solid black line is a linear regression to the data (y = 0.99x + 0.95). The positive shift of the predicted slants of perceived frontoparallel reflects the slight haptic bias.
Figure 4.
Figure 4.
Adaptation predictions and data. A, Adaptation of each estimator in the conditions with high (magenta circles) and low visual reliability (purple squares). Each symbol represents the adaptation observed for one subject in one condition. The adaptation of each estimator was quantified as the difference between the preadaptation and postadaptation slants of perceived frontoparallel (PSEVPost − PSEVpre, PSEHPost − PSEHpre). Error bars on the data points represent ±1 SD of this difference. The visual-dominance model predicts that all the data would lie on the vertical dotted line. The reliability-based model (Eq. 5) predicts that the data from the two reliability conditions will fall on the dashed purple (3 times more visual than haptic adaptation) and dashed magenta (1/3 times more visual than haptic adaptation) lines. The solid lines represent the best fits to the data that passed through zero. The shaded areas around the solid lines represent 95% confidence intervals for the best-fit lines from 1000 bootstrapped datasets. B, Group-average predictions and results. The average proportion of visual and haptic adaptation is plotted in the two reliability conditions: high and low visual reliability (rV:rH = 3:1 and rV:rH = 1:3, respectively). The horizontal dotted blue and red lines represent the visual dominance predictions for visual and haptic changes, respectively, as a function of reliability ratio. All of the change is predicted to be haptic, regardless of reliability ratio. The diagonal dashed blue and red lines show the predictions of the reliability-based model for visual and haptic changes as a function of reliability ratio. The blue squares and red circles represent the visual and haptic data. Error bars represent 95% confidence intervals computed from 1000 bootstrapped datasets.
Figure 5.
Figure 5.
Simulation results for estimators with the reliability ratio (rV:rH) set to 1:3 and an adaptation rate of 0.05. Different adaptation rates did not change the qualitative effects. For different combination weights and calibration proportions, we calculated the variance of the combined estimate over time for 1000 simulated trials following an initial discrepancy. The left, center, and right columns represent the results when the visual–haptic discrepancy introduced at time 0 was large (5σV2), medium (σV2), and small (σV2/5), respectively. The estimators did not drift randomly. The panels in the upper two rows plot the visual, haptic, and combined estimates over time (blue, red, and green, respectively). The upper row shows adaptation when the visual calibration proportion (pV) was appropriate for reliability-based adaptation (pV = 1 − wV). The middle row shows adaptation when the visual calibration proportion was inappropriate for reliability-based adaptation (pV = wV). The bottom row summarizes adaptation for a wide variety of parameters. The abscissa is the visual calibration proportion (pV). The ordinate is the visual combination weight (wV). Color represents the variance of the combined estimate over time, dark red representing the smallest variance. The white circles indicate the position of minimum variance in each figure. The white-lettered labels A–F indicate the parts of those surfaces that are shown in the panels of the upper two rows. The dashed yellow circles indicate the optimal calibration rule given that rV:rH equaled 1:3: the visual calibration proportion and visual combination weight that should yield minimum variance according to the reliability-based model.
Figure 6.
Figure 6.
Simulation results showing the variance of the combined estimate when the estimates undergo a random walk. The abscissa in each panel is the visual calibration proportion (pV) and the ordinate is the visual combination weight (wV). Color represents the variance of the combined estimate over time, dark red representing the smallest variance. The visual and haptic estimates were characterized by random walks with drifts of dV and dH. The recalibration rate was set with a Kalman filter. The estimator reliability ratio (rV:rH) was 1:3, as in the simulation in Figure 5. The top, middle, and bottom rows show the results when the drift magnitude, dV + dH, was large (σV2 + σH2), medium [(σV2 + σH2) × 10−2], and small [(σV2 + σH2) × 10−4], respectively. The two columns on the left show the results when the discrepancy introduced between the visual and haptic estimates was large (5σV2), and the two columns on the right show the results when the introduced discrepancy was small (1/5σV2). The first and third columns display the results when the drift ratio (dV:dH) was 3:1 and the second and fourth columns the results when the ratio was 1:3. The dashed yellow circles mark the predictions if minimum variance were determined by the reliability-based model (i.e., by the ratio of estimator reliabilities rV:rH); they are always at (0.75, 0.25) because the reliability ratio was always 1:3. The dashed blue circles represent the predictions if the minimum variance were determined only by the drift ratio dV:dH. The white circles indicate the calibration proportions and combination weights that yielded the combined estimate with the lowest variance.

References

    1. Adams WJ, Banks MS, van Ee R. Adaptation to three-dimensional distortions in human vision. Nat Neurosci. 2001;4:1063–1064. - PubMed
    1. Alais D, Burr D. The ventriloquist effect results from near-optimal cross-modal integration. Curr Biol. 2004;14:257–262. - PubMed
    1. Atkins JE, Jacobs RA, Knill DC. Experience-dependent visual cue recalibration based on discrepancies between visual and haptic percepts. Vision Res. 2003;43:2603–2613. - PubMed
    1. Baddeley RJ, Ingram HA, Miall RC. System identification applied to a visuomotor task: near-optimal human performance in a noisy changing task. J Neurosci. 2003;23:3066–3075. - PMC - PubMed
    1. Burge J, Ernst MO, Banks MS. The statistical determinants of adaptation rate in human reaching. J Vis. 2008;8:20.1–19. - PMC - PubMed

Publication types