

Dietary patterns associated with fat and bone mass in young children
- PMID: 20519562
- PMCID: PMC2904032
- DOI: 10.3945/ajcn.2009.28925
Dietary patterns associated with fat and bone mass in young children
Abstract
Background: Obesity and osteoporosis have origins in childhood, and both are affected by dietary intake and physical activity. However, there is little information on what constitutes a diet that simultaneously promotes low fat mass and high bone mass accrual early in life.
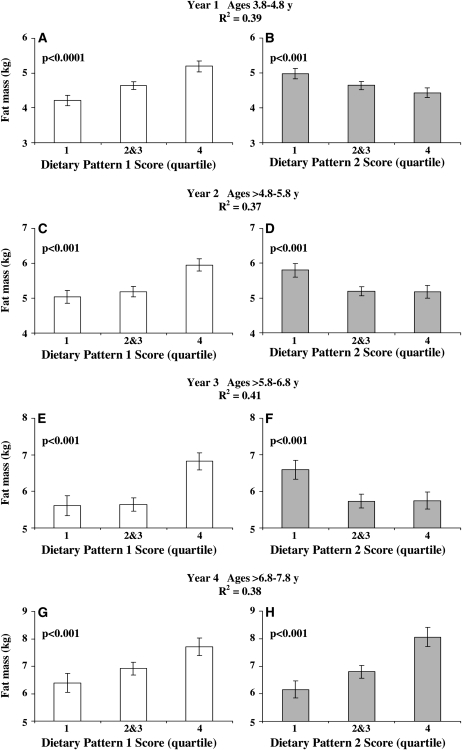
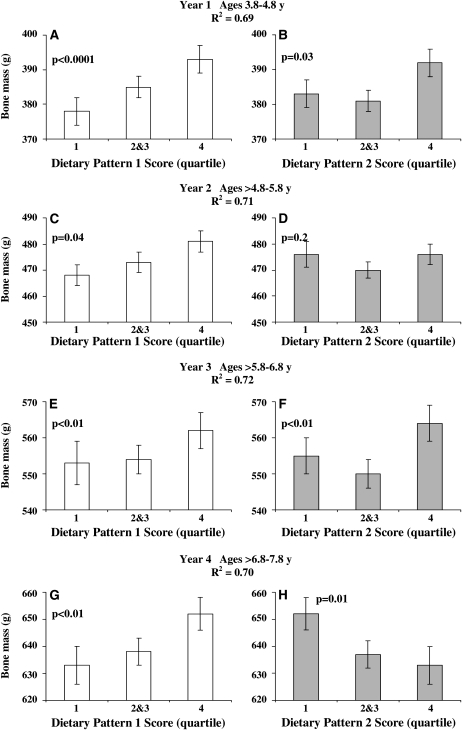
Objective: Our objective was to identify dietary patterns related to fat and bone mass in children during the age period of 3.8-7.8 y.
Design: A total of 325 children contributed data from 13 visits over 4 separate study years (age ranges: 3.8-4.8, >4.8-5.8, >5.8-6.8, and >6.8-7.8 y). We performed reduced-rank regression to identify dietary patterns related to fat mass and bone mass measured by dual-energy X-ray absorptiometry for each study year. Covariables included race, sex, height, weight, energy intake, calcium intake, physical activity measured by accelerometry, and time spent viewing television and playing outdoors.
Results: A dietary pattern characterized by a high intake of dark-green and deep-yellow vegetables was related to low fat mass and high bone mass; high processed-meat intake was related to high bone mass; and high fried-food intake was related to high fat mass. Dietary pattern scores remained related to fat mass and bone mass after all covariables were controlled for (P < 0.001-0.03).
Conclusion: Beginning at preschool age, diets rich in dark-green and deep-yellow vegetables and low in fried foods may lead to healthy fat and bone mass accrual in young children.
Figures
Comment in
-
Identifying dietary patterns by using reduced rank regression.Am J Clin Nutr. 2010 Dec;92(6):1537; author reply 1537-8. doi: 10.3945/ajcn.2010.30155. Epub 2010 Sep 29. Am J Clin Nutr. 2010. PMID: 20881061 No abstract available.
References
-
- Nicklas TA, Webber LS, Berenson GS. Studies of consistency of dietary intake during the first four years of life in a prospective analysis: Bogalusa Heart Study. J Am Coll Nutr 1991;10:234–41 - PubMed
-
- Boulton TJ, Magarey AM, Cockington RM. Tracking of serum lipids and dietary energy, fat and calcium intake from 1 to 15 years. Acta Paediatr 1995;84:1050–5 - PubMed
-
- Whitaker RC, Wright JA, Pepe MS, Seidel KD, Dietz WH. Predicting obesity in young adulthood from childhood and parental obesity. N Engl J Med 1997;337:869–73 - PubMed
-
- Hasanoglu A, Bideci A, Cinaz P, Tumer L, Unal S. Bone mineral density in childhood obesity. J Pediatr Endocrinol Metab 2000;13:307–11 - PubMed
Publication types
MeSH terms
Substances
Grants and funding
LinkOut - more resources
Full Text Sources
Medical
