. 2010 Sep 2;116(9):1498-505.
doi: 10.1182/blood-2009-11-251074. Epub 2010 Jun 2.

Aurora kinases A and B are up-regulated by Myc and are essential for maintenance of the malignant state

Affiliations

Aurora kinases A and B are up-regulated by Myc and are essential for maintenance of the malignant state

Jürgen den Hollander et al. Blood. .

Abstract

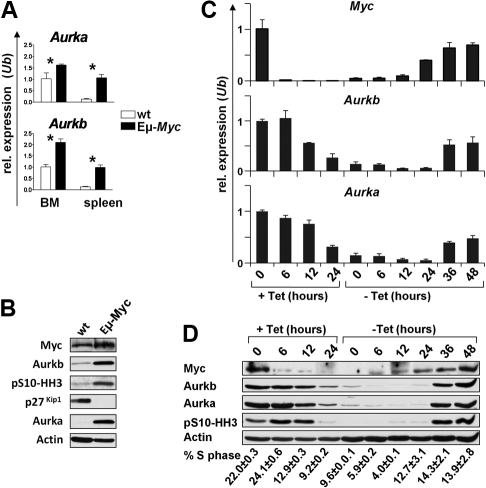
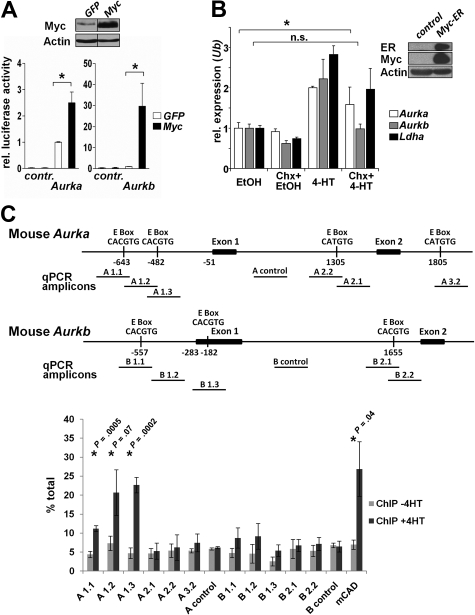
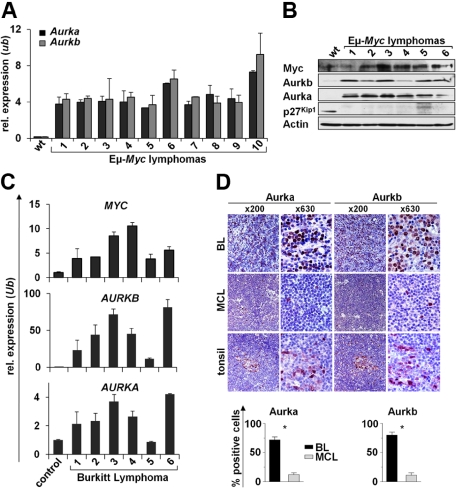
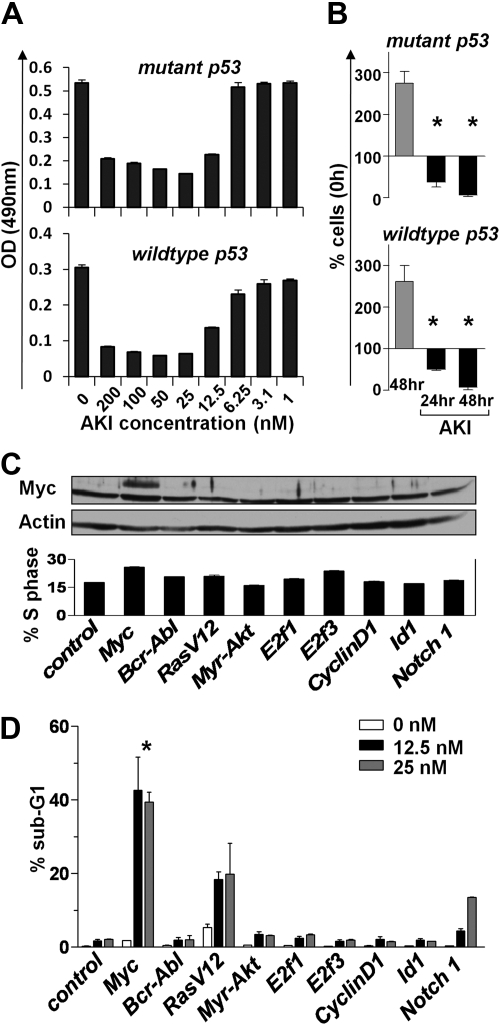
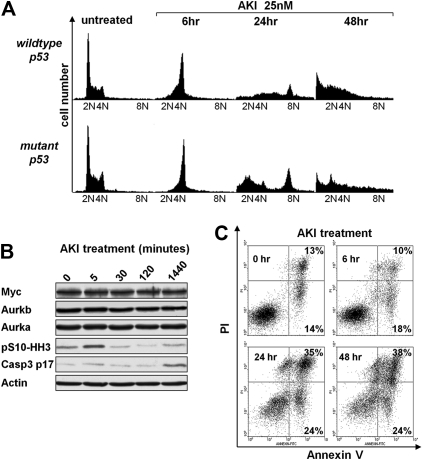
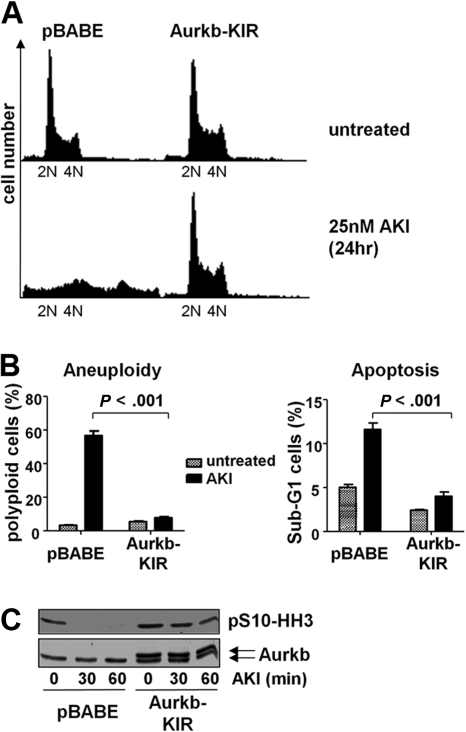
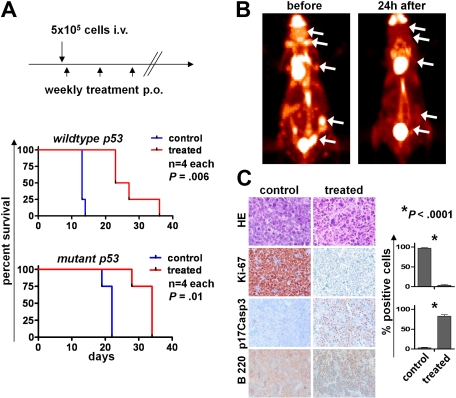
Myc oncoproteins promote continuous cell growth, in part by controlling the transcription of key cell cycle regulators. Here, we report that c-Myc regulates the expression of Aurora A and B kinases (Aurka and Aurkb), and that Aurka and Aurkb transcripts and protein levels are highly elevated in Myc-driven B-cell lymphomas in both mice and humans. The induction of Aurka by Myc is transcriptional and is directly mediated via E-boxes, whereas Aurkb is regulated indirectly. Blocking Aurka/b kinase activity with a selective Aurora kinase inhibitor triggers transient mitotic arrest, polyploidization, and apoptosis of Myc-induced lymphomas. These phenotypes are selectively bypassed by a kinase inhibitor-resistant Aurkb mutant, demonstrating that Aurkb is the primary therapeutic target in the context of Myc. Importantly, apoptosis provoked by Aurk inhibition was p53 independent, suggesting that Aurka/Aurkb inhibitors will show efficacy in treating primary or relapsed malignancies having Myc involvement and/or loss of p53 function.


Figures

Figure 1
Figure 1
Myc up-regulates the expression of Aurka and Aurkb. (A) Quantitative SYBR Green real-time PCR analysis (quantitative RT-PCR) of Aurka and Aurkb transcript levels in bone marrow (BM) and splenic (spleen) B220+ B cells from 4-week-old wild-type (wt; white bars) or Eμ-Myc (black bars) littermate mice. Levels of mRNA are standardized to the expression of Ubiquitin (Ub). Bars represent the mean of 3 experiments ± SEM. *P < .05. (B) Immunoblot analysis of the indicated proteins in splenic B220+ B cells from 4-week-old wild-type (wt) or Eμ-Myc-transgenic littermate mice. (C) Quantitative RT-PCR analysis of c-Myc, Aurka, and Aurkb RNA expression in P493-6 human B cells that bear a tetracycline-regulated Myc gene. The cells were treated with tetracycline for the indicated time (+Tet), washed, and cultured in tetracycline-free medium (−Tet). Levels of mRNAs were standardized to the expression of Ubiquitin (Ub), which is not regulated by Myc. (D) Top panel: Immunoblot analysis of the indicated proteins from the same P493-6 cells as in panel C. The numbers below the immunoblots indicate the percentage of cells in S phase (PI staining) assessed by flow cytometry. Tet indicates tetracycline.
Figure 2
Figure 2
Aurka is a direct Myc target gene, whereas Aurkb is indirectly up-regulated by Myc. (A) Top panel: Immunoblot analysis of NIH-3T3 cells infected with Myc or GFP control retrovirus. Vertical lines have been inserted to indicate a repositioned gel. Bottom panel: NIH-3T3 cells were transiently transfected with the indicated firefly luciferase promoter-reporter constructs and assessed for relative luciferase activity. Shown is the relative luciferase activity in Myc-expressing versus GFP-only expressing cells. Renilla luciferase plasmids were cotransfected to normalize for transfection efficiency. Bars represent the mean ± SEM of 3 independent experiments, each performed in duplicate. *P < .05. (B) Right panel: Immunoblot analysis of NIH-3T3 cells infected with retroviruses encoding MSCV-Myc-ER-IRES-Puro. Left panel: After puromycin selection, cells expressing Myc-ER were cultured in the presence or absence of 4HT and/or cycloheximide (Chx) for 4 hours to activate preexisting Myc-ER in the presence or absence of protein synthesis. Ethanol (EtOH) was the vehicle for 4HT. The cells were harvested and RNA prepared for quantitative RT-PCR in which primers directed against Aurka, Aurkb, Ldha, and Ubiquitin (Ub) were used. Levels of mRNA were standardized to the expression of Ub. Bars represent the mean ± SD from 3 experiments. The up-regulation of all genes is significant on Myc activation in the absence of Chx (P < .05). The induction of Aurka by Myc is significant in the presence of Chx. *P < .05. n.s. indicates not significant. (C) ChIP analysis for Myc binding to mouse Aurk genes in Balb/c-3T3 fibroblasts expressing Myc-ER. Top panel: Map of the murine Aurka and Aurkb gene regions analyzed and the location of the E-boxes and amplicons used to detect Myc binding by quantitative PCR after ChIP. Amplicons A1.1, A1.2, A1.3, A2.2, A.2.1, A3.2, and A control detect Aurka, whereas amplicons B1.1, B1.2, B1.3, B2.1, B2.2, and B control detect Aurkb genomic DNA. Chromatin was isolated from cells 6 hours after activation of Myc-ER (+4HT) or uninduced (−4HT) and immunoprecipitated with antibody against c-Myc. Quantitative PCR was carried out on immunoprecipitated chromatin and input chromatin and expressed as percentage total using the calculation % total = 2Ct input − Ct ChIP × % input used for ChIP. Shown is the mean of 3 experiments ± SD. *P values comparing −4HT and +4HT samples.
Figure 3
Figure 3
Elevated Aurka and Aurkb are hallmarks of Myc-driven lymphoma. (A) Quantitative RT-PCR analysis of Aurka and Aurkb expression in 10 Eμ-Myc lymphomas versus splenic wild-type (wt) B220+ B cells. Levels of mRNA were normalized to the expression of Ubiquitin (Ub). (B) Immunoblot analysis of the indicated proteins in wild-type (wt) control splenic B220+ B cells vs Eμ-Myc lymphomas. (C) Quantitative RT-PCR analysis of Myc, Aurka, and Aurkb mRNA expression in 6 human BL samples compared with CD19+ control B cells. Levels of mRNA were normalized to the expression of Ubiquitin (Ub). (D) Immunohistochemical analysis of Aurka and Aurkb expression in BL, MCL, and control tissue (tonsils). Top panel: Representative samples at low- (original magnification ×200) and high-power (original magnification ×630) views. Image acquisition: Zeiss Axioplan 2 microscope; 63×/0.95 numeric aperture (NA) Plan-Neofluar air objective (high-power views), 20×/0.5 NA Plan-Neofluar air objective (low-power views); Zeiss Axiocam MRc 5 camera; Axiovision Rel 4.6 scanning software. Bottom panels: Percentage of cells that stain positive for Aurka and Aurkb. A grid ocular objective was used to count 400 cells over 3 high-power fields (original magnification ×40). Bars represent the mean percentage of positive cells from 5 BL and 5 MCL samples ± SD. *Significant difference (P < .001).
Figure 4
Figure 4
Aurk inhibition blocks Myc-driven proliferation. (A) Primary Eμ-Myc lymphoma cells (having either wild-type or mutant p53) were cultured ex vivo until feeder-independent lines were established. These were treated for 24 hours with the indicated concentrations of the AKI AS703569. Effects on proliferation were assessed using an MTT assay. Shown is a representative experiment of 3 experiments performed. Bars represent the mean ± SD. (B) Proliferation of primary ex vivo cultured Eμ-Myc lymphoma cells treated for the indicated times with 25nM AS703569 (AKI). Control cells (gray bars) were left untreated for 48 hours. Bars represent the mean ± SEM percentage of cells compared with input cells set as 100% of 3 independent experiments. *Significant difference compared with control cells (P < .01). (C) Rat-1 fibroblasts were stably infected with the retroviruses expressing the indicated oncogenes and were then treated with the indicated doses of the AKI AS703569. Top panel: Immunoblot analysis of c-Myc levels. Actin was used as a loading control. Bottom panel: Percentage of Rat-1 cells in S phase assessed by PI staining for DNA content. (D) The antiproliferative effect of the AKI AS703569 in Rat-1 cells driven by the indicated oncogenes. Asynchronously growing cells were treated with AKI AS703569 at the indicated concentrations (white, black, and gray bars) for 48 hours and assessed for cell death by flow cytometric analysis of DNA content (PI). Bars represent the mean percentage of cells with a sub-G1 DNA content ± SD of 3 independent experiments. *P < .05 of Myc-infected cells compared with other cells.
Figure 5
Figure 5
Aurk inhibition triggers mitotic arrest and polyploidy and induces apoptosis of Eμ-Myc lymphoma cells irrespective of the p53 status. (A) Eμ-Myc lymphoma cells cultured ex vivo were treated for the indicated times with 25nM AS703569 (AKI) and assessed for DNA content by flow cytometric analysis of PI-stained cells. The PI-stained cells were analyzed using the FL2 channel in a linear scale. Shown are representative histograms. The quantification and statistical analyses of 3 independently performed experiments are provided in supplemental Figure 4. (B) Eμ-Myc lymphoma cells were treated for the indicated times with the AKI AS703569 (25nM). Expression of the indicated proteins was assessed using immunoblotting. (C) Untreated Eμ-Myc lymphoma cells or cells treated with 25nM AS703569 (AKI) for the indicated times were analyzed for their apoptotic index by staining with annexin V–PI. Cells in the top right quadrant represent late apoptotic/necrotic cells. Cells in the bottom right quadrant represent early apoptotic cells. The percentage of cells in these quadrants is given. Shown is one representative dot blot graph of 3 independently performed experiments.
Figure 6
Figure 6
Overexpression of an AKI-resistant mutant of Aurkb renders Myc-expressing lymphoma cells resistant to Aurk inhibition. (A) Eμ-Myc lymphoma cells were infected with control virus (pBABE) or pBABE-AurkbG160V (Aurkb-KIR) encoding retrovirus. The cells were then selected with puromycin and treated with 25nM AS703569 (AKI) for 24 hours. The representative histogram shows the DNA content assessed by PI staining. (B) Quantification of aneuploidy and apoptosis on AKI treatment in control cells and cells expressing of Aurk-KIR. Cells were treated with carrier only (untreated) or 25nM AS703569 (AKI) and subjected to DNA content analysis using PI staining and flow cytometry. The PI-stained cells were analyzed using the FL2 channel in a linear scale. Apoptosis measurements were based on the percentage of cells that carried less than diploid DNA content (Sub-G1) in the FL3 channel in a logarithmic scale. (C) Control cells (pBABE) or cells expressing mutant Aurkb (Aurkb-KIR) were treated for the indicated time with 25nM AS703569 (AKI) and assessed for Aurkb and phosphorylated S10-HH3 levels by immunoblotting. Note that Aurkb-KIR was Flag-tagged and migrates slightly slower than endogenous Aurkb.
Figure 7
Figure 7
Aurk activity is required for maintenance of Myc-driven lymphoma in vivo. (A) Top panel: Schedule of lymphoma cell injection and AS703569 treatment (60 mg/kg body weight, once weekly per oral gavage). Bottom panels: Survival curves. p53 wild-type or p53 mutant Eμ-Myc lymphoma cells were injected intravenously into syngeneic recipients, and mice were followed for lymphoma onset. The differences between the control and Aurk inhibitor treatment groups (treated) are statistically significant. (B) FDG-PET scans were performed before and 24 hours after a single oral treatment with Aurk inhibitor (AS703569, 60 mg/kg body weight) in a mouse with manifest lymphoma. (C) Histologic assessment of Aurk inhibition in manifest lymphomas. Top row: Hematoxylin and eosin (HE) staining shows massive necrosis after Aurk inhibition in treated versus control mice (lymph node). Immunohistochemistry for the indicated markers shows a reduction of proliferating cells as assessed by Ki-67 positivity (second row) and increased apoptotic cell death assessed by staining for cleaved (p17) caspase-3 (p17Casp3; third row). Image acquisition: Zeiss Axioplan 2 microscope; 20×/0.5 NA Plan-Neofluar air objective; Zeiss Axiocam MRc 5 camera; Axiovision Rel 4.6 scanning software; original magnification ×200. Right panel: Quantification of the percentage of Ki-67 and p17Casp3-positive cells in control lymphomas or lymphomas from mice treated 24 hours with a single dose of the Aurk inhibitor AS703569. Bars represent the mean percentage ± SEM of positive cells from lymph nodes from 3 different control or AS703569-treated mice.

References

    1. Boxer LM, Dang CV. Translocations involving c-myc and c-myc function. Oncogene. 2001;20(40):5595–5610. - PubMed
    1. Dang CV. c-Myc target genes involved in cell growth, apoptosis, and metabolism. Mol Cell Biol. 1999;19(1):1–11. - PMC - PubMed
    1. Bernard S, Eilers M. Control of cell proliferation and growth by Myc proteins. Results Probl Cell Differ. 2006;42:329–342. - PubMed
    1. Baudino TA, McKay C, Pendeville-Samain H, et al. c-Myc is essential for vasculogenesis and angiogenesis during development and tumor progression. Genes Dev. 2002;16(19):2530–2543. - PMC - PubMed
    1. Pelengaris S, Khan M, Evan GI. Suppression of Myc-induced apoptosis in beta cells exposes multiple oncogenic properties of Myc and triggers carcinogenic progression. Cell. 2002;109(3):321–334. - PubMed

Publication types

MeSH terms