. 2010 Aug;185(4):1167-81.
doi: 10.1534/genetics.110.118265. Epub 2010 Jun 2.

Differential replication of two chloroplast genome forms in heteroplasmic Chlamydomonas reinhardtii gametes contributes to alternative inheritance patterns

Affiliations

Differential replication of two chloroplast genome forms in heteroplasmic Chlamydomonas reinhardtii gametes contributes to alternative inheritance patterns

Yoshiki Nishimura et al. Genetics. 2010 Aug.

Abstract

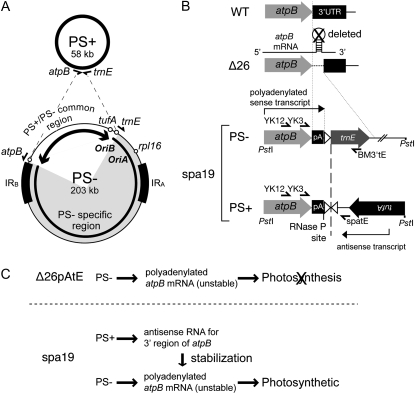
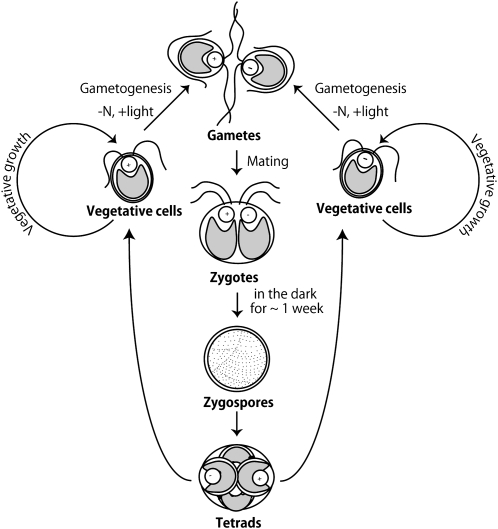
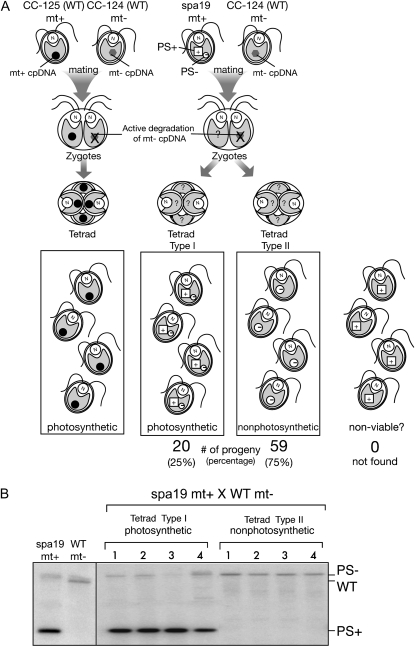
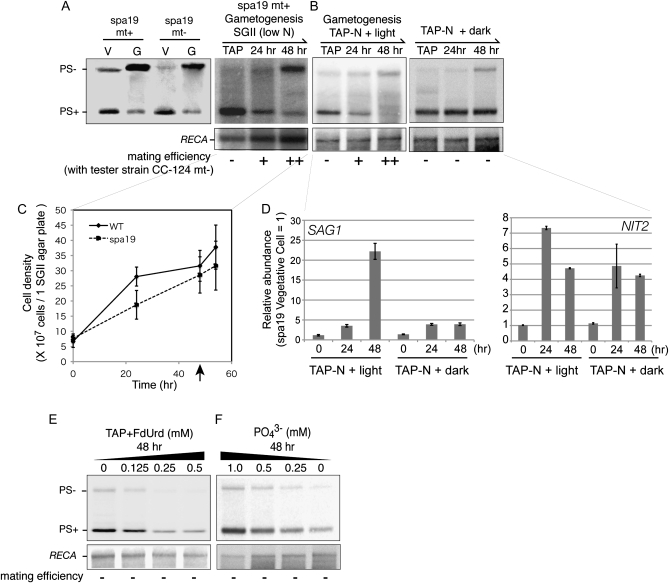
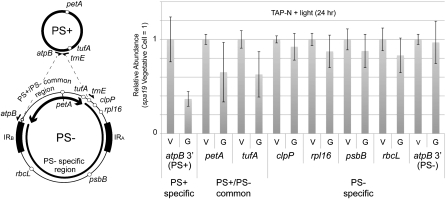
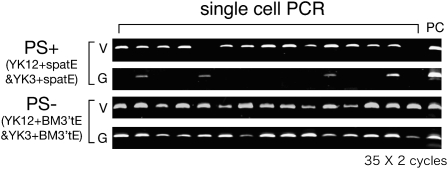
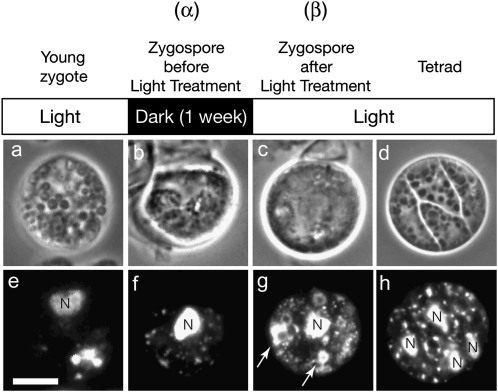
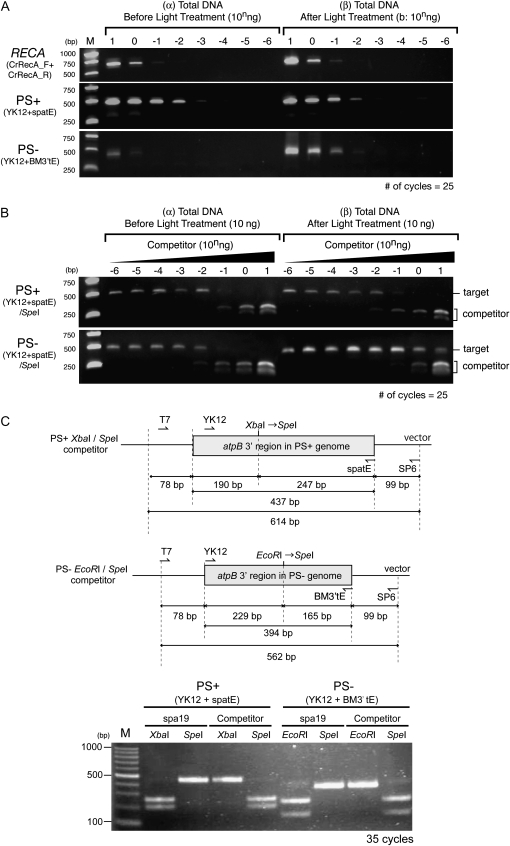
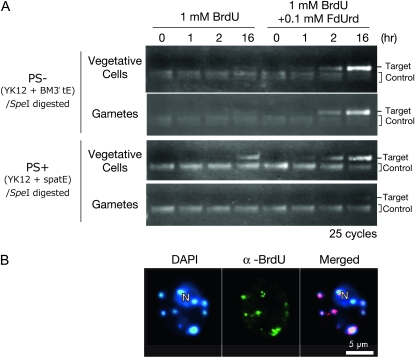
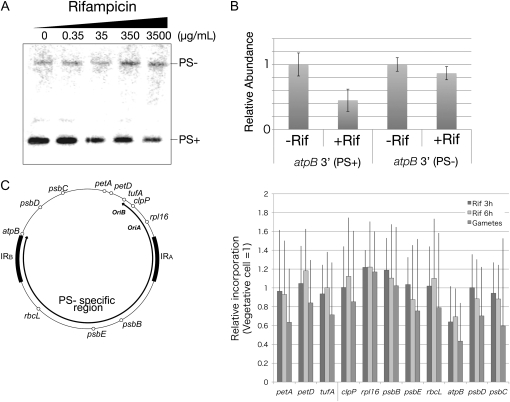
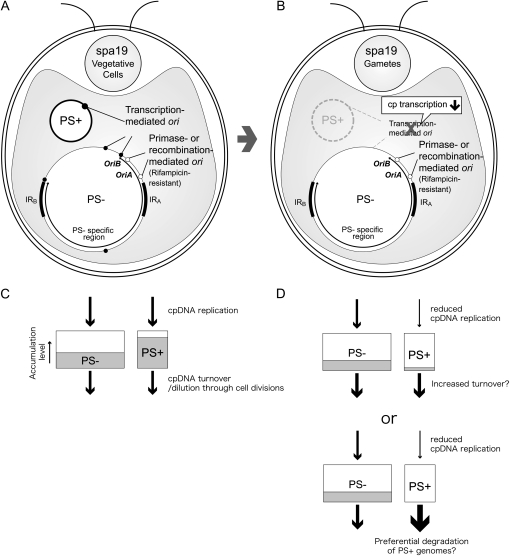
Two mechanisms for chloroplast DNA replication have been revealed through the study of an unusual heteroplasmic strain of the green alga Chlamydomonas reinhardtii. Heteroplasmy is a state in which more than one genome type occurs in a mitochondrion or chloroplast. The Chlamydomonas strain spa19 bears two distinct chloroplast genomes, termed PS+ and PS-. PS+ genomes predominate and are stably maintained in vegetative cells, despite their lack of known replication origins. In sexual crosses with spa19 as the mating type plus parent, however, PS+ genomes are transmitted in only approximately 25% of tetrads, whereas the PS- genomes are faithfully inherited in all progeny. In this research, we have explored the mechanism underlying this biased uniparental inheritance. We show that the relative reduction and dilution of PS+ vs. PS- genomes takes place during gametogenesis. Bromodeoxyuridine labeling, followed by immunoprecipitation and PCR, was used to compare replication activities of PS+ and PS- genomes. We found that the replication of PS+ genomes is specifically suppressed during gametogenesis and germination of zygospores, a phenomenon that also was observed when spa19 cells were treated with rifampicin, an inhibitor of the chloroplast RNA polymerase. Furthermore, when bromodeoxyuridine incorporation was compared at 11 sites within the chloroplast genome between vegetative cells, gametes, and rifampicin-treated cells by quantitative PCR, we found that incorporation was often reduced at the same sites in gametes that were also sensitive to rifampicin treatment. We conclude that a transcription-mediated form of DNA replication priming, which may be downregulated during gametogenesis, is indispensable for robust maintenance of PS+ genomes. These results highlight the potential for chloroplast genome copy number regulation through alternative replication strategies.


Figures

F<sc>igure</sc> 1.—
Figure 1.—
Chloroplast genome organization in spa19. (A) Structures of the two chloroplast genomes of spa19, named PS+ and PS−. The PS+ genome deletion is shaded. The positions and orientations of atpB, trnE, rpl16, OriA, and OriB are indicated by circles and arrows. The inverted repeats (IR) are represented by solid boxes. (B) Detail of the PS− and PS+ genome atpB regions. In PS− genomes, the region downstream of atpB is engineered to encode a poly(A) sequence (pA), an RNase P site, and trnE (solid arrow) with its promoter (open triangle). In the PS+ genome, the sequence downstream of the trnE promoter is altered due to the PS+ genome deletion and is connected to the endogenous trnE promoter and tufA in inverted orientation, which is ∼145 kb distant in WT cp genomes. The rearrangement breakpoint is delineated by a vertical dashed line. The rearrangement enables distinction between these two genomes either by DNA gel blot analysis (using PstI) or by PCR. Primer sets YK12/YK3+spatE and YK12/YK3+BM3′tE specifically amplify the PS+ and PS− genomes, respectively. (C) The PS− genome produces unstable polyadenylated atpB mRNA. Since atpB encodes the β-subunit of ATP synthetase, which is required for photosynthesis, the PS− genome alone cannot support photosynthesis (top). The PS+ genome generates antisense transcripts to the atpB mRNA 3′ region, which suppress instability of the sense transcripts, thereby restoring photosynthesis (bottom).
F<sc>igure</sc> 2.—
Figure 2.—
Sexual life cycle of Chlamydomonas reinhardtii.
F<sc>igure</sc> 3.—
Figure 3.—
spa19 inheritance patterns. (A) Scheme of the observed inheritance patterns. According to classic chloroplast genetics, all four tetrad progeny inherit cpDNA from the mt+ parent (left column). In this cross, however, both type I and type II tetrads were obtained, as described in the text. For the mt+ parents, WT cpDNA is represented as a solid circle, or in the case of spa19 the PS+ and PS- genomes as open squares and open circles, respectively. The PS+ label is larger to represent its increased stoichiometry relative to the PS− genome. (B) Genotypes of the resulting progeny were verified by DNA gel blot. Total DNAs of WT, spa19, and tetrad progeny were digested with PstI, and a gel blot was probed with the atpB coding region. The migrations of PS+- and PS−-specific genome fragments are indicated at the right. The WT atpB band migrates slightly faster than that of the PS− genome.
F<sc>igure</sc> 4.—
Figure 4.—
Behavior of PS+ and PS− genomes. Total DNAs were isolated from spa19 cells grown on (A) TAP (vegetative cells, V) or SGII (gametes, G); or (B) nitrogen-depleted TAP (TAP-N) under high light or in the dark for 24 or 48 hr. The DNAs were digested with PstI and analyzed by filter hybridization using the atpB PCR product amplified by YK11 and KY09 as a probe. Duplicate samples were blotted on another membrane and probed with RECA, which is a nuclear gene. Note that the DNA samples of 24 hr and 48 hr were overloaded in the right side of A. Mating efficiencies (see materials and methods) are shown under the gels. (C) Cell growth of WT (solid line) and spa19 (dashed line) during gametogenesis was measured by counting the number of cells on SGII agar plates (see materials and methods) and in Tsubo mating buffer. The arrow indicates the timing when cells were suspended in Tsubo mating buffer as the final step of gametogenesis. (D) Total RNAs were isolated from cells grown on nitrogen-depleted TAP (TAP-N) under the high light or in the dark as in B. cDNAs were prepared and the relative abundances of SAG1 and NIT2 mRNAs were analyzed by qPCR. The data were normalized to the transcript level for MAA7, and then the levels for SAG1 and NIT2 were set to 1 in vegetative cells for comparative purposes. Error bars represent standard deviations based on three independent experiments. DNAs and mating efficiency were analyzed as for A and B for (E) cells grown in TAP with the indicated concentrations of FdUrd for 48 hr and (F) in TAP modified to contain the indicated concentrations of phosphate.
F<sc>igure</sc> 5.—
Figure 5.—
The relative abundances of PS+ and PS− genomes were compared by qPCR between of spa19 vegetative cells (V) and cells incubated for 24 hr under nitrogen-depleted and high light condition (gametes, G). The regions analyzed are shown below each graph. Positions of the genes are shown on the left. The data were normalized to the nuclear gene MAA7, and then the amount in vegetative cells was set to 1. Error bars represent standard deviations based on three independent experiments.
F<sc>igure</sc> 6.—
Figure 6.—
Analysis of PS+ genome loss. Single vegetative cells (V) and gametes (G) were isolated and used for PS+/PS− genome-specific nested PCR analysis, as described in materials and methods. PC, positive control for PCR. Note that individual cells were analyzed in each case; in other words, the same cell was never analyzed for the presence of both PS+ and PS− genomes due to the method employed.
F<sc>igure</sc> 7.—
Figure 7.—
Phase contrast (a–d) and fluorescent images (e–h) of SYBR Green I-stained young zygotes (a,e), zygospores (b, f), germinating zygospores (c, g), and tetrads (d, h), from the cross CC-125 mt+ × CC-124 mt−. The bar in e is 5 μm. The white arrows in g highlight increased fluorescent intensity of cp/mtDNA. After organellar DNA amplification, meiosis began and organellar DNAs were distributed equally to the progeny (d, h)
F<sc>igure</sc> 8.—
Figure 8.—
Preferential increase of PS− genomes in germinating zygotes. (A) PCR analysis to compare the amplification of PS+ and PS− genomes during zygote germination. Total DNAs from zygospores before (α) and after (β) light treatment were compared using 25 PCR cycles. The indicated amounts (10∼10−6 ng) of total DNA were used as template, and the nuclear RECA signal was used as an indicator of DNA concentration. Primer sets are indicated at the left for each set of reactions. (B) Competitive PCR to compare the amplification of PS+ and PS− genomes in germinating zygospores. Ten nanograms of total DNA (α or β) was mixed with the indicated amount of competitor and used as templates for PS+ and PS− specific PCR. The PCR products were digested with SpeI to distinguish genomic DNA from the competitor. Primer sets and restriction enzymes used are shown at the left. (C) Top, schematic of competitors for PS+ and PS− genomes with altered restriction sites (PS+, XbaI → SpeI; PS−, EcoRI → SpeI). These fragments were cloned, enabling their amplification with either T7/SP6 primers or with the PS+/PS− genome-specific primer pairs. Bottom, PCR fragments amplified from spa19 total DNA and competitors with the genome-specific primers, digested with indicated restriction enzymes.
F<sc>igure</sc> 9.—
Figure 9.—
Anaysis of DNA replication. (A) Chloroplast DNA replication activity was compared between PS+ and PS− genomes by BrdU labeling/immunoprecipitation analysis. spa19 vegetative cells and gametes were incubated for the indicated number of hours in the presence of 1 mm BrdU with or without 0.1 mm FdUrd. Total DNA was extracted, 25 ng of BrdUTP-labeled PS+(X/S) or PS− (E/S) fragments were added, the samples were sonicated and denatured, and immunoprecipitation was carried out with an anti-BrdU antibody. The precipitated DNA was analyzed by PS+ or PS− genome-specific PCR. To distinguish the target and control, PCR products were digested with SpeI. (B) Fluorescent images of a single WT cell treated with 1 mm BrdU and 0.1 mm FdUrd for 16 hr. The cell was simultaneously stained with DAPI (left) and an anti-BrdU antibody (center); the images are merged at right. In the merged image, the α-BrdU signal has been recolored in pink for clarity.
F<sc>igure</sc> 10.—
Figure 10.—
Effect of rifampicin on cpDNA abundance. (A) Gel blot analysis of PstI-digested total DNA. Rifampicin was added to the indicated concentrations to spa19 vegetative cells at the beginning of a dark period, and cells were cultured 16 hr before DNA extraction. (B) The relative abundances of PS+ and PS− genomes in spa19 cells treated or untreated with 350 μg/ml rifampicin for 16 hr was analyzed by qPCR using primer sets specific for the atpB region of the PS+ or PS− genome. The data were normalized to the nuclear gene MAA7, and then the amount in untreated cells was set to 1. Error bars represent standard deviations based on three independent experiments. (C) CC-125 vegetative cells, gametes, and cells treated with 350 μg/ml rifampicin for 3 or 6 hr were labeled with 1 mm BrdU + 0.1 mm FdUrd for 1 hr. BrdU-labeled total DNA was extracted. BrdUTP-labeled PCR product, 25 ng (aadA), was added as an internal control. The DNA samples were heat denatured, immunoprecipitated, and analyzed by qPCR using primers for the genes shown beneath each set of bars. The DNA level for each gene was set to 1 for untreated vegetative cells, as indicated by the shadedhorizontal line across the graph. The locations of the genes are shown below as related to the entire chloroplast genome. Error bars represent standard deviations based on three PCR analyses.
F<sc>igure</sc> 11.—
Figure 11.—
Model for preferential replication of the PS− genomes in gametes. (A) In vegetative cells, WT cpDNA, represented here as the spa19 PS− genome, can be replicated following either transcription-, recombination-, or primase-mediated priming. On the other hand, PS+ genomes are maintained solely by transcription-mediated priming (shaded circle), since they lack OriA and OriB. (B) In gametes, the transcription-dependent mechanism is depressed because of downregulated chloroplast transcription, slowing PS+ genome replication, whereas PS− genomes are replicated via OriA or OriB. Due to their inefficient replication, PS+ genomes are infrequently passed to daughter gametes. Thus, the remaining PS+ genomes are not replicated and become diluted to produce type II tetrads, which lack PS+ genomes. (C) The accumulation of cpDNA at any given point is determined by the balance between input (cpDNA replication) and outputs (cpDNA turnover and dilution through cell divisions) of cpDNA. (D) In gametes, however, the accumulation level of PS+ genomes is preferentially lowered due to the reduced replication of PS+ genomes. It is also possible that this process is facilitated by preferential degradation of PS+ genomes in gametes.

Similar articles

Cited by

References

    1. Azhagiri, A. K., and P. Maliga, 2007. Exceptional paternal inheritance of plastids in Arabidopsis suggests that low-frequency leakage of plastids via pollen may be universal in plants. Plant J. 52 817–823. - PubMed
    1. Barr, C. M., M. Neiman and D. R. Taylor, 2005. Inheritance and recombination of mitochondrial genomes in plants, fungi and animals. New Phytol. 168 39–50. - PubMed
    1. Bendich, A. J., 2004. Circular chloroplast chromosomes: the grand illusion. Plant Cell 16 1661–1666. - PMC - PubMed
    1. Bennett, J. L., and D. A. Clayton, 1990. Efficient site-specific cleavage by RNase MRP requires interaction with two evolutionarily conserved mitochondrial RNA sequences. Mol. Cell. Biol. 10 2191–2201. - PMC - PubMed
    1. Bolen, P. L., N. W. Gillham and J. E. Boynton, 1980. Evidence for persistence of chloroplast markers in the heteroplasmic state in Chlamydomonas reinhardtii. Curr. Genet. 2 159–167. - PubMed

Publication types

MeSH terms

Substances