Comparative Study
. 2010 May 24;5(5):e10770.
doi: 10.1371/journal.pone.0010770.

Integrative genome comparison of primary and metastatic melanomas

Affiliations
Comparative Study

Integrative genome comparison of primary and metastatic melanomas

Omar Kabbarah et al. PLoS One. .

Abstract

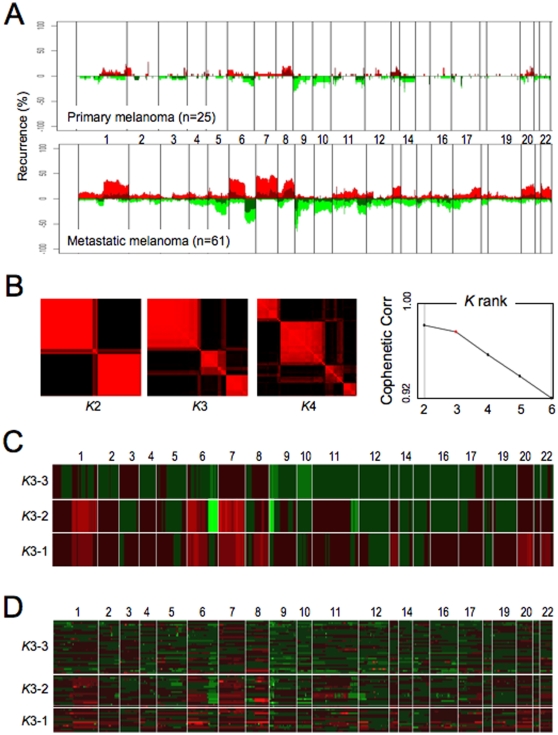
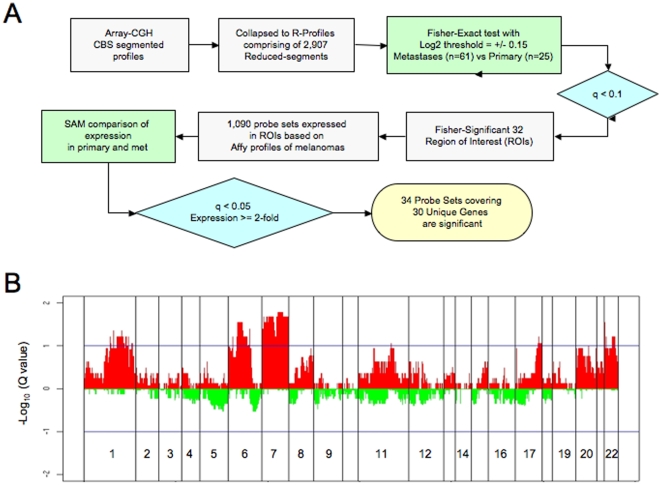
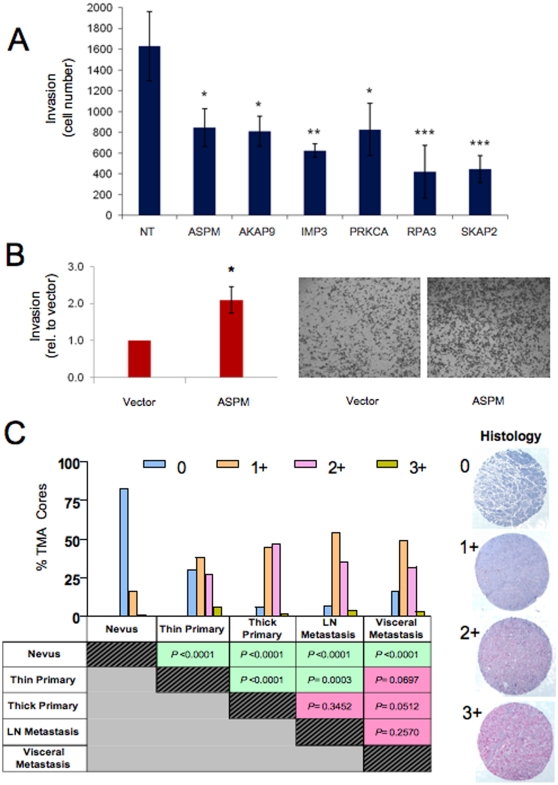
A cardinal feature of malignant melanoma is its metastatic propensity. An incomplete view of the genetic events driving metastatic progression has been a major barrier to rational development of effective therapeutics and prognostic diagnostics for melanoma patients. In this study, we conducted global genomic characterization of primary and metastatic melanomas to examine the genomic landscape associated with metastatic progression. In addition to uncovering three genomic subclasses of metastastic melanomas, we delineated 39 focal and recurrent regions of amplification and deletions, many of which encompassed resident genes that have not been implicated in cancer or metastasis. To identify progression-associated metastasis gene candidates, we applied a statistical approach, Integrative Genome Comparison (IGC), to define 32 genomic regions of interest that were significantly altered in metastatic relative to primary melanomas, encompassing 30 resident genes with statistically significant expression deregulation. Functional assays on a subset of these candidates, including MET, ASPM, AKAP9, IMP3, PRKCA, RPA3, and SCAP2, validated their pro-invasion activities in human melanoma cells. Validity of the IGC approach was further reinforced by tissue microarray analysis of Survivin showing significant increased protein expression in thick versus thin primary cutaneous melanomas, and a progression correlation with lymph node metastases. Together, these functional validation results and correlative analysis of human tissues support the thesis that integrated genomic and pathological analyses of staged melanomas provide a productive entry point for discovery of melanoma metastases genes.


Conflict of interest statement

Competing Interests: The authors have declared that no competing interests exist.

Figures

Figure 1
Figure 1. Array-CGH characterization of the primary and metastatic melanoma genomes.
(A) Summary of genomic profiles of primary and metastatic melanomas and the recurrence of chromosomal alterations. Recurrence of CNAs across the samples in segmented data (y axis) is plotted for each probe evenly aligned along the x axis in chromosomal order. The percentage of tumors harboring gains, amplifications, losses and deletions for each locus is depicted according to the following scheme: dark red (gains with a log2 ratio > = 0.15) and green (loss with a log2 ratio < = −0.15) and are plotted along with bright red (amplifications with a log2 ratio ≥ 0.4) and bright green (deletions with log2 ratio ≤−0.4). (B) Consensus matrices show how often samples are assigned to the same clusters during 100 repetitions of gNMF, computed at K = 2–4 for the 61 metastatic melanoma dataset. Each pixel represents how often a particular pair of samples clusters together, colored from 0% (black, samples are never in the same cluster) to 100% (red, samples are always in the same cluster). Ranks 2 and 3 classification show stable assignments into 2 and 3 blocks, respectively; in contrast, rank 4 assignments are disrupted. Cophenetic correlation coefficients for hierarchically clustered matrices in B. Valid clustering should show correlation close to 1. (C) gNMF classification with rank K = 3 identifies three distinct subgroups. Array-CGH profiles of 61 metastatic melanomas were subjected to gNMF analyses (100 repetitions). Y axis indicates the centroid of three subgroups identified by gNMF. X axis coordinates represent genomic map order (from chromosome 1 to chromosome 22). The colors denote gained (red) or deleted (green) chromosome material. (D) Heat-map plot showing discrete CNAs within all samples, with the X axis coordinates represent genomic map position and Y axis indicates individual samples of the three subgroups identified by gNMF. Red represents chromosomal gain or amplification, and green denotes chromosomal loss or deletion.
Figure 2
Figure 2. Integrative genomics identify high-confidence metastasis candidate melanoma genes.
(A) Flow chart of integrating copy number and expression analysis to compare primary and metastastic melanoma genomes. (B) Whole genome q-value profiles based on Fisher's Exact Test between primary and metastastic melanomas. X axis coordinates represent genomic map position and Y axis indicates q-value log10 of Fisher's Exact Test between primary and metastastic melanomas at each R-segment.
Figure 3
Figure 3. Functional and histopathologic characterization of high-confidence metastasis candidate genes.
(A) Knockdown of 6 candidate metastasis genes by siRNA inhibited 1205LU Boyden Chamber cell migration. Data represents the average of three replicates. Statistical significance was assessed using a Tukey-Kramer Multiple Comparisons Test, in which each target was compared to the effect of a non-targeting siRNA pool. * = p<0.05; ** = p<0.01; *** = p<0.001. The level of target mRNA knockdown is shown in Supplemental Figure S5. (B) Exogenous expression of ASPM enhanced invasion through Matrigel compared to empty vector control on a modified Boyden Chamber assay. Representative images of Boyden chamber assays are shown on the right. Data represent three independent experiments. (C) Immunohistochemical survey of Survivin on a melanoma progression tissue microarray. Survivin expression was scored as 0–3+ (see Methods). Percent of TMA cores scored 0 to 3+ for major histopathlogical categories (benign nevi, thin and thick primary cutaneous melanomas, lymph node and visceral metastases) are plotted with p values calculated by χ2 test shown in the table below. Representative cores are shown to demonstrate, from top to bottom, intensity of cytoplasmic Survivin expression scored as 0 for no staining, 1+ for mild stain intensity, 2+ for moderate stain intensity, and 3+ for intense stain intensity.

Similar articles

Cited by

References

    1. Tarhini AA, Agarwala SS. Cutaneous melanoma: available therapy for metastatic disease. Dermatol Ther. 2006;19:19–25. - PubMed
    1. Hoeflich KP, Herter S, Tien J, Wong L, Berry L, et al. Antitumor efficacy of the novel RAF inhibitor GDC-0879 is predicted by BRAFV600E mutational status and sustained extracellular signal-regulated kinase/mitogen-activated protein kinase pathway suppression. Cancer Res. 2009;69:3042–3051. - PubMed
    1. Chin L, Garraway LA, Fisher DE. Malignant melanoma: genetics and therapeutics in the genomic era. Genes Dev. 2006;20:2149–2182. - PubMed
    1. Van Raamsdonk CD, Bezrookove V, Green G, Bauer J, Gaugler L, et al. Frequent somatic mutations of GNAQ in uveal melanoma and blue naevi. Nature. 2009;457:599–602. - PMC - PubMed
    1. Kim M, Gans JD, Nogueira C, Wang A, Paik JH, et al. Comparative oncogenomics identifies NEDD9 as a melanoma metastasis gene. Cell. 2006;125:1269–1281. - PubMed

Publication types

MeSH terms