. 2010 May 24;5(5):e10777.
doi: 10.1371/journal.pone.0010777.

Optimisation of bioluminescent reporters for use with mycobacteria

Affiliations

Optimisation of bioluminescent reporters for use with mycobacteria

Nuria Andreu et al. PLoS One. .

Abstract

Background: Mycobacterium tuberculosis, the causative agent of tuberculosis, still represents a major public health threat in many countries. Bioluminescence, the production of light by luciferase-catalyzed reactions, is a versatile reporter technology with multiple applications both in vitro and in vivo. In vivo bioluminescence imaging (BLI) represents one of its most outstanding uses by allowing the non-invasive localization of luciferase-expressing cells within a live animal. Despite the extensive use of luminescent reporters in mycobacteria, the resultant luminescent strains have not been fully applied to BLI.

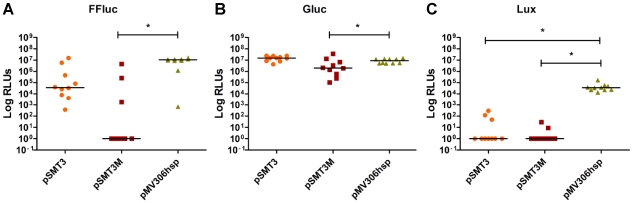
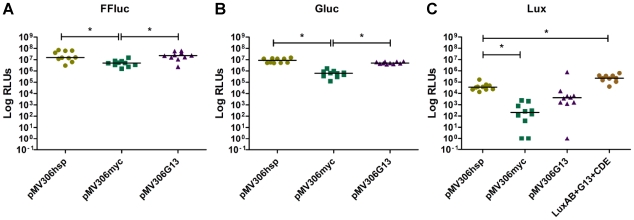
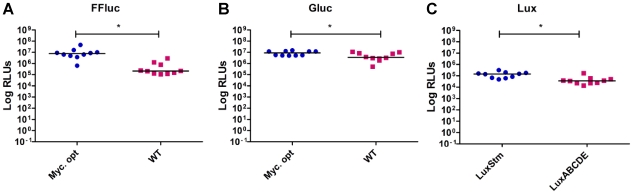
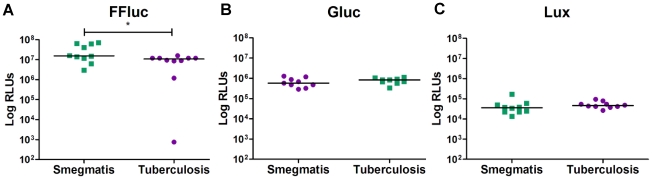
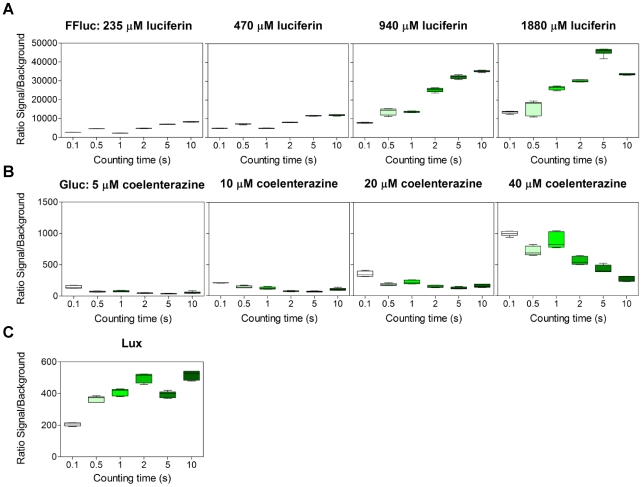
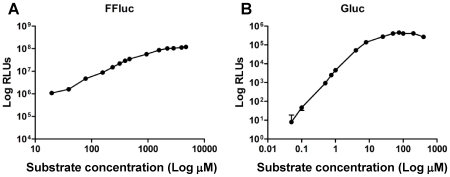
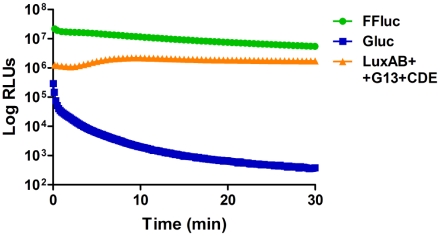
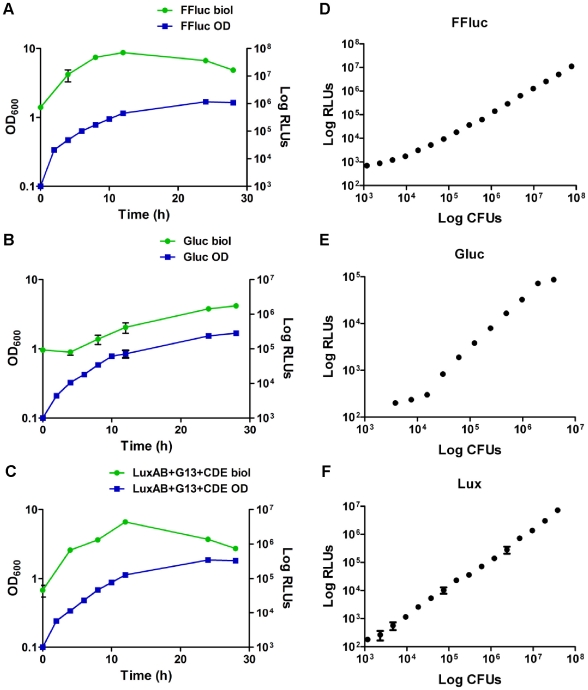
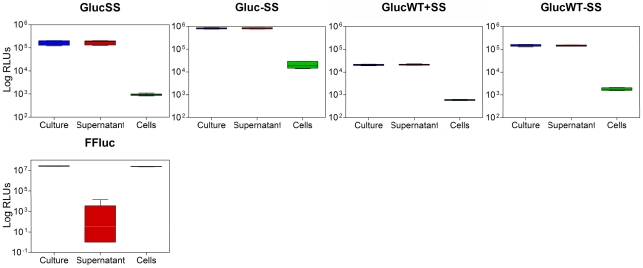
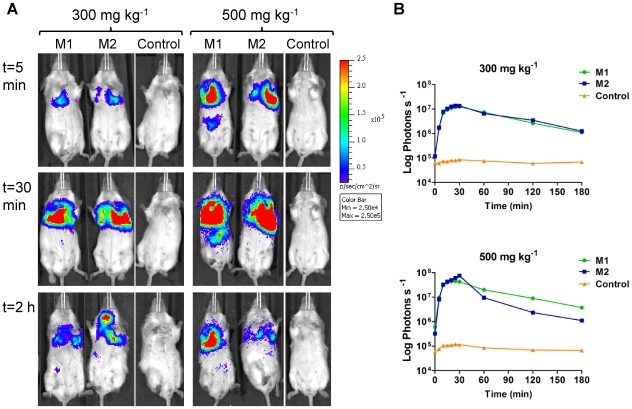
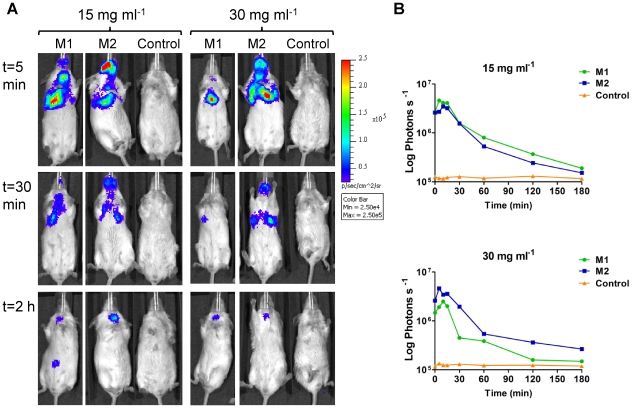
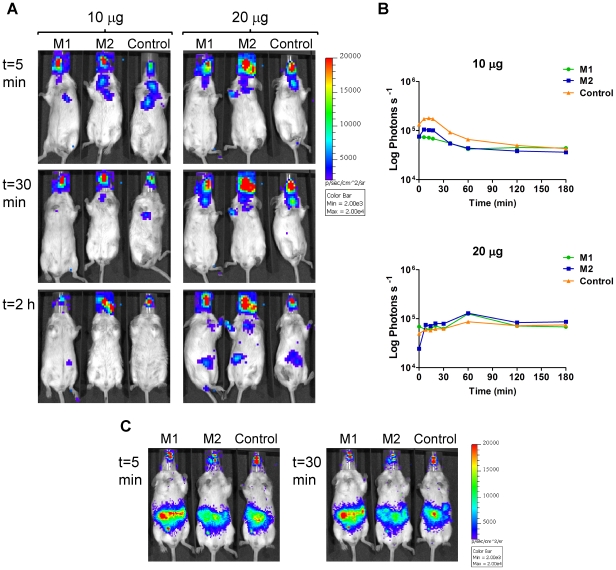
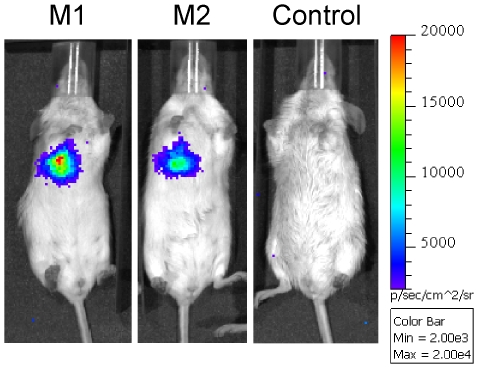
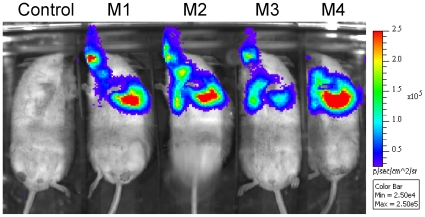
Methodology/principal findings: One of the main obstacles to the use of bioluminescence for in vivo imaging is the achievement of reporter protein expression levels high enough to obtain a signal that can be detected externally. Therefore, as a first step in the application of this technology to the study of mycobacterial infection in vivo, we have optimised the use of firefly, Gaussia and bacterial luciferases in mycobacteria using a combination of vectors, promoters, and codon-optimised genes. We report for the first time the functional expression of the whole bacterial lux operon in Mycobacterium tuberculosis and M. smegmatis thus allowing the development of auto-luminescent mycobacteria. We demonstrate that the Gaussia luciferase is secreted from bacterial cells and that this secretion does not require a signal sequence. Finally we prove that the signal produced by recombinant mycobacteria expressing either the firefly or bacterial luciferases can be non-invasively detected in the lungs of infected mice by bioluminescence imaging.

Conclusions/significance: While much work remains to be done, the finding that both firefly and bacterial luciferases can be detected non-invasively in live mice is an important first step to using these reporters to study the pathogenesis of M. tuberculosis and other mycobacterial species in vivo. Furthermore, the development of auto-luminescent mycobacteria has enormous ramifications for high throughput mycobacterial drug screening assays which are currently carried out either in a destructive manner using LuxAB or the firefly luciferase.


Conflict of interest statement

Competing Interests: The authors have declared that no competing interests exist.

Figures

Figure 1
Figure 1. Expression from an integrating vector results in the highest and most stable bioluminescent signal.
To study the effect of copy number on light production each reporter was cloned into standard (pSMT3), high (pSMT3M), and single copy number (pMV306hsp) vectors. Luminescence was measured for 10 independent M. smegmatis transformants each carrying the FFluc (a), Gluc (b) and Lux (c) constructs. Results are given as relative light units (RLUs) and are corrected for the background. Overall differences between groups were assessed using the Kruskal–Wallis non-parametric test with differences between subgroups assessed by Dunn's multiple comparisons test and those found to be significant (p<0.01) are indicated with *.
Figure 2
Figure 2. Expression of luciferases using promoters Phsp60 and PG13 leads to greater light production.
Luminescence of M. smegmatis expressing ffluc (a), gluc (b) and lux (c) was assayed using Phsp60, PmyctetO, and PG13 in the integrating vector pMV306. Each dot represents a randomly selected transformant. Results are given as relative light units (RLUs) and are corrected for the background. Statistical significance was evaluated by the Kruskal–Wallis test with subgroup analysis performed by Dunn's multiple comparison test and those found to be significant (p<0.05) are indicated with *.
Figure 3
Figure 3. Codon optimisation increases bioluminescence in vitro.
Relative light units (RLUs) were measured in 10 M. smegmatis clones transformed with a wild-type or a Mycobacterium optimised FFluc (a) or Gluc (b), or with a Gram positive or Streptomyces optimised Lux (c). In all cases pMV306hsp was used as backbone. Results are corrected for the background. Statistical significance was evaluated by the Mann-Whitney non-parametric test for FFluc and Lux, and by unpaired t test for Gluc (data normality passed) and those found to be significant (p<0.05) are indicated with *.
Figure 4
Figure 4. Bioluminescence levels in M. tuberculosis and M. smegmatis are comparable in vitro.
Relative light units (RLUs) were measured in 10 M. smegmatis and 10 M. tuberculosis clones transformed with pMV306hsp+FFluc (a), pMV306hsp+Gluc (b) or pMV306hsp+Lux (c). Results are corrected for the background. Statistical significance was evaluated by the Mann-Whitney non-parametric test for Lux, and by unpaired t test for FFluc and Gluc (data normality passed) and those found to be significant (p<0.05) are indicated with *.
Figure 5
Figure 5. Signal:noise for FFluc and Lux increases with integration time, and decreases for Gluc.
Luminescence was measured using six different integration times and four different substrate concentrations for M. smegmatis producing FFluc (a) and Gluc (b), or without substrate for Lux (c). The background luminescence was obtained from cultures of M. smegmatis with the empty pMV306hsp. Assays were performed with three independent mid-log cultures and each culture was measured in duplicate. As the data was not normally distributed, median values are displayed (bar) with inter-quartile ranges (box), and highest and lowest values (whiskers).
Figure 6
Figure 6. Bioluminescence correlates with substrate concentration at low concentrations.
Luminescence (given as relative light units [RLUs]) of M. smegmatis pMVhsp+FFluc (a) and M. smegmatis pMVhsp+Gluc (b) was measured with integration times of 5 s and 0.1 s respectively. The substrate concentrations assayed ranged from 20 to 4710 µM luciferin for FFluc, and from 0.05 to 400 µM coelenterazine for Gluc. Means and standard deviations (smaller than symbols) of six replicates are shown.
Figure 7
Figure 7. Light production from FFluc and Lux is stable, whereas the signal from Gluc rapidly dissipates.
Luminescence (given as relative light units [RLUs]) was measured every 10 s for gluc-expressing M. smegmatis and every 30 s for ffluc- or lux-expressing M. smegmatis, over a 30 min period. The integration times used were 0.1 s, 5 s and 10 s for Gluc, FFluc and Lux respectively. At time point 0 min, 470 µM luciferin or 40 µM coelenterazine were added to FFluc- and Gluc-producing M. smegmatis respectively. Two independent cultures were used for FFluc and Lux, and three for Gluc. Each culture was measured in duplicate and the means and standard deviations (smaller than symbols) are plotted.
Figure 8
Figure 8. Bioluminescence correlates with cell density during exponential growth in vitro.
Cultures of M. smegmatis pMVhsp+FFluc (a), pMVhsp+Gluc (b) and pMVhsp+Lux (c) were inoculated to an optical density (OD) at 600 nm of 0.1 and the OD and the luminescence [given as relative light units (RLUs)] measured over 28 h. The luminescence was measured with integration times of 5, 0.1, and 10 s respectively, and substrate concentrations of 470 µM luciferin for FFluc and 40 µM coelenterazine for Gluc. The values represented correspond to the means of two independent cultures measured in triplicate. The error bars indicate standard deviations. A near linear relationship was found between bioluminescence [given as RLUs] and colony counts (given as colony forming units [CFU]) for mid-log cultures of M. smegmatis pMVhsp+FFluc (d), pMVhsp+Gluc (e) and pMVhsp+Lux (f) using a plate luminometer.
Figure 9
Figure 9. Gaussia luciferase is secreted from mycobacterial cells.
Luminescence (given as relative light units [RLUs]) was measured in culture, supernatant and cell samples of M. smegmatis producing Gluc Mycobacterium optimised with (GlucSS) or without (Gluc) signal peptide, Gluc wild-type with (GlucWT+SS) or without (GlucWT-SS) signal peptide, and FFluc as control. Assays were performed with three independent cultures and each culture was measured in duplicate. As the data was not normally distributed, median values are displayed (bar) with inter-quartile ranges (box), and highest and lowest values (whiskers).
Figure 10
Figure 10. Kinetics of FFluc activity in M. smegmatis infected mice after intraperitoneal injection of luciferin.
Mice were endotracheally inoculated with 1.4×10⁷ CFU of M. smegmatis pMV306hsp+FFlucWT [two representative mice (M1 and M2) out of four are shown] or with 6.8×10⁶ CFU of M. smegmatis pMV306hsp (control). 300 mg kg−1 or 500 mg kg−1 luciferin intraperitoneal was given 24 h post-inoculation and images were acquired at time points 0 (immediately after substrate administration), 5, 10, 15, 20, 25, 30, 60, 120 and 180 min. (a) Images were obtained using an IVIS Spectrum and are displayed as pseudocolour images of peak bioluminescence (given as photons s−1 cm−2 steridian [sr]−1), with variations in colour representing light intensity at a given location. Mice injected with 300 mg kg−1 luciferin were imaged with an integration time of 1 min, whereas those that received 500 mg kg−1 luciferin were imaged for 10 s to avoid saturation of the image. Three representative time points are shown. (b) Bioluminescence (given as photons s−1) in the thorax was quantified for each time point using the region of interest tool in the Living Image software program.
Figure 11
Figure 11. Kinetics of FFluc activity in M. smegmatis infected mice after intranasal administration of luciferin.
Mice were endotracheally inoculated with 6.6×10⁶ CFU of M. smegmatis pMV306hsp+FFlucWT [two representative mice (M1 and M2) out of four are shown] or with 6.8×10⁶ CFU of M. smegmatis pMV306hsp as a control (one representative mouse out of two is shown). 20 µl of 15 mg ml−1 or 30mg ml−1 luciferin intranasal was administered 24 h post-inoculation and mice were imaged 0, 5, 10, 15, 30, 60, 120 and 180 min after. (a) Images were obtained using an IVIS Spectrum and are displayed as pseudocolour images of peak bioluminescence (given as photons s−1 cm−2 sr−1). Red represents the most intense light emission while blue correspond to the weakest signal. The colour bar indicates relative signal intensity. Mice were imaged with an integration time of 30 s. Three representative time points are shown. (b) Signal intensity (given as photons s−1) in the lungs was quantified for each time point using the region of interest tool in the Living Image software program.
Figure 12
Figure 12. BLI of gluc-expressing M. smegmatis.
Mice were endotracheally inoculated with 3.32×10⁶ CFU of M. smegmatis pMV306hsp+Gluc [two representative mice (M1 and M2) out of three are shown,) or with 1.58×10⁷ CFU of M. smegmatis pMV306hsp as a control (one out of two mice is shown). 10 µg of coelenterazine intranasal was administered 24 h post-inoculation and mice were imaged at time points 0, 5, 10, 15, 30, 60, 120 and 180 min. (a) Images were obtained using an IVIS Spectrum and are displayed as pseudocolour images of peak bioluminescence (given as photons s−1 cm−2 sr−1), with variations in colour representing light intensity at a given location. Integration time was 5 min. (b) Bioluminescence (given as photons s−1) was quantified using the Living image software. (C) 10 µg of coelenterazine was given intraperitoneally to the same mice 5 h post-intranasal coelenterazine. Mice were imaged 0, 5, 10, 15, 20, 25 and 30 min post-intraperitoneal coelenterazine with integration times of 3 min.
Figure 13
Figure 13. BLI of lux-expressing M. smegmatis.
Mice were inoculated endotracheally with M. smegmatis pMV306hsp+LuxAB+G13+CDE [7.9×10⁶ CFU, two mice (M1 and M2) out of four are shown] or M. smegmatis pMV306hsp (6.8×10⁶ CFU, control) and imaged 24 h post-inoculation. Images were obtained using an IVIS Spectrum and are displayed as pseudocolour images of peak bioluminescence (given as photons s−1 cm−2 sr−1), with variations in colour representing light intensity at a given location. Mice were imaged with an integration time of 5 min.
Figure 14
Figure 14. BLI of ffluc-expressing M. tuberculosis.
Mice were inoculated endotracheally with 5×10⁶ CFU of either wild-type M. tuberculosis (control) or FFluc-producing M. tuberculosis. 20 µl of 30 mg ml−1 luciferin was administered intranasally and mice were imaged 5–10 min after. Mice were contained in a large air-tight box for safety considerations. The image was obtained using an IVIS Spectrum and is displayed as a pseudocolour image of peak bioluminescence (given as photons s−1 cm−2 sr−1). Red represents the most intense light emission while blue correspond to the weakest signal. The colour bar indicates relative signal intensity. Mice were imaged with an integration time of 1 min.

Similar articles

Cited by

References

    1. WHO. Global tuberculosis control 2009. 2009. 303. Epidemiology, strategy, financing: WHO Press.
    1. Hutchens M, Luker GD. Applications of bioluminescence imaging to the study of infectious diseases. Cell Microbiol. 2007;9:2315–2322. - PubMed
    1. Wright JS, 3rd, Jin R, Novick RP. Transient interference with staphylococcal quorum sensing blocks abscess formation. Proc Natl Acad Sci U S A. 2005;102:1691–1696. - PMC - PubMed
    1. Lane MC, Alteri CJ, Smith SN, Mobley HL. Expression of flagella is coincident with uropathogenic Escherichia coli ascension to the upper urinary tract. Proc Natl Acad Sci U S A. 2007;104:16669–16674. - PMC - PubMed
    1. Steinhuber A, Landmann R, Goerke C, Wolz C, Fluckiger U. Bioluminescence imaging to study the promoter activity of hla of Staphylococcus aureus in vitro and in vivo. Int J Med Microbiol. 2008;298:599–605. - PubMed

Publication types