. 2010 May 24;5(5):e10790.
doi: 10.1371/journal.pone.0010790.

Epistatic relationships between sarA and agr in Staphylococcus aureus biofilm formation

Affiliations

Epistatic relationships between sarA and agr in Staphylococcus aureus biofilm formation

Karen E Beenken et al. PLoS One. .

Abstract

Background: The accessory gene regulator (agr) and staphylococcal accessory regulator (sarA) play opposing roles in Staphylococcus aureus biofilm formation. There is mounting evidence to suggest that these opposing roles are therapeutically relevant in that mutation of agr results in increased biofilm formation and decreased antibiotic susceptibility while mutation of sarA has the opposite effect. To the extent that induction of agr or inhibition of sarA could potentially be used to limit biofilm formation, this makes it important to understand the epistatic relationships between these two loci.

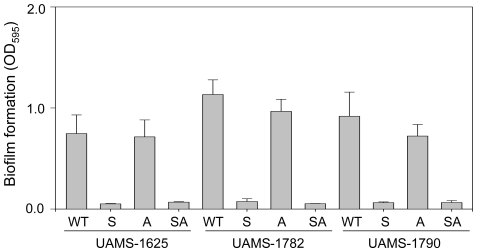
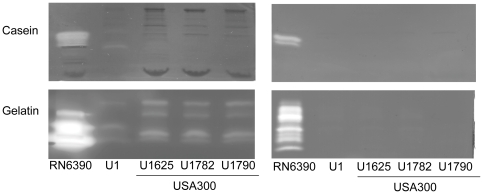
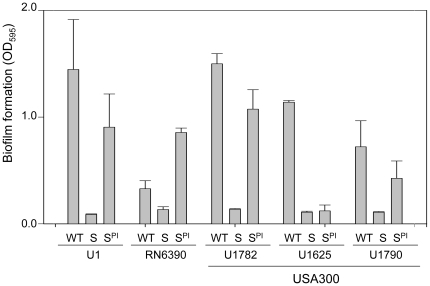
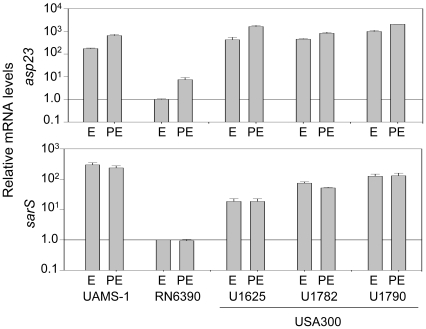
Methodology/principal findings: We generated isogenic sarA and agr mutants in clinical isolates of S. aureus and assessed the relative impact on biofilm formation. Mutation of agr resulted in an increased capacity to form a biofilm in the 8325-4 laboratory strain RN6390 but had little impact in clinical isolates S. aureus. In contrast, mutation of sarA resulted in a reduced capacity to form a biofilm in all clinical isolates irrespective of the functional status of agr. This suggests that the regulatory role of sarA in biofilm formation is independent of the interaction between sarA and agr and that sarA is epistatic to agr in this context. This was confirmed by demonstrating that restoration of sarA function restored the ability to form a biofilm even in the corresponding agr mutants. Mutation of sarA in clinical isolates also resulted in increased production of extracellular proteases and extracellular nucleases, both of which contributed to the biofilm-deficient phenotype of sarA mutants. However, studies comparing different strains with and without proteases inhibitors and/or mutation of the nuclease genes demonstrated that the agr-independent, sarA-mediated repression of extracellular proteases plays a primary role in this regard.

Conclusions and significance: The results we report suggest that inhibitors of sarA-mediated regulation could be used to limit biofilm formation in S. aureus and that the efficacy of such inhibitors would not be limited by spontaneous mutation of agr in the human host.


Conflict of interest statement

Competing Interests: The authors have declared that no competing interests exist.

Figures

Figure 1
Figure 1. Production of RNAIII as a function of strain, growth phase, and growth medium.
RNA was extracted from each strain grown in biofilm medium (BM) during the exponential (E, OD560 = 1.0), post-exponential growth phase (PE, OD560 = 3.0) and stationary (S) phases and the amount of RNAIII determined by qRT-PCR. RNA was also isolated from stationary-phase cultures grown in TSB. The value observed with UAMS-1 during the exponential growth phase was set at 1.0 with the results observed for other strains shown relative to this value. Results are shown as the mean ± the standard deviation of triplicate samples. Statistical analysis of the results observed in stationary-phase samples grown in BM confirmed a significant difference between RN6390 and all other strains and between UAMS-1782 and UAMS-1790 by comparison to both UAMS-1 and UAMS-1625.
Figure 2
Figure 2. Biofilm formation in isolates of the USA300 clonal lineage.
Biofilm formation was assessed using a microtiter plate assay as previously described . Results are shown as the mean ± the standard deviation of 6 replicate samples from each strain. Statistical analysis confirmed a significant difference between RN6390 and each of the other strains.
Figure 3
Figure 3. Impact of plasma coating on biofilm formation.
Biofilm formation was assessed in UAMS-1 and each of three USA300 isolates (WT) and their isogenic agr (A) mutants using a static microtiter plate assay with and without plasma coating. Results are shown as the mean ± the standard deviation of 6 replicate samples. Statistical analysis confirmed a significant difference in all strains based on the presence vs. absence of plasma coating. No significant differences were observed between any wild-type strain and its isogenic agr mutant irrespective of whether plasma coating was employed.
Figure 4
Figure 4. Impact of sarA and agr on biofilm formation in USA300 isolates.
Biofilm formation was assessed in each of three USA300 isolates (WT) and their isogenic sarA (S), agr (A), and sarA/agr (SA) mutants using a static microtiter plate assay. Results are shown as the mean ± the standard deviation of 6 replicate samples. Statistical analysis confirmed a significant difference between each wild-type strain and its isogenic sarA and sarA/agr mutants but no difference between any wild-type strains and its agr mutant or between isogenic sarA and sarA/agr mutants.
Figure 5
Figure 5. Production of extracellular proteases in USA300 isolates.
Supernatants were harvested from overnight (15 hr) cultures grown in TSB (left) or biofilm medium (right) and standardized with respect to each other prior to zymographic analysis using both casein (top) and gelatin gels (bottom).
Figure 6
Figure 6. Relationships between sarA, agr, protease production and biofilm formation.
Biofilm formation and the production of extracellular proteases was assessed in the indicated wild-type (WT) strains and their isogenic sarA (S), agr (A), and sarA/agr (SA) mutants with and without complementation with a functional copy of sarA (SC). Results for biofilm assay (top) are shown as the mean ± the standard deviation of 6 replicate samples. Statistical analysis confirmed a significant difference between the RN6390 agr and sarA-complemented RN6390 sarA/agr mutants and all other RN6390 derivative and between the sarA and sarA/agr mutants and their sarA-complemented derivatives in both UAMS-1 and UAMS-1782. No significant differences were observed the sarA-complemented derivatives of UAMS-1 or UAMS-1782 and their respective parent strains.
Figure 7
Figure 7. The impact of protease inhibitors on biofilm formation in S. aureus sarA mutants.
Biofilm formation was assessed in each of the indicated strains (WT) and their isogenic sarA mutants with (SPI) and without (S) the inclusion of protease inhibitors. Results are shown as the mean ± the standard deviation of 6 replicate samples. Statistical analysis confirmed a significant difference between each wild-type strain and its sarA mutant and, with the exception of UAMS-1625, between the sarA mutants assayed in the presence or absence of protease inhibitors. In RN6390 and UAMS-1782, the difference between the wild-type strain and its isogenic sarA mutant assayed in the presence of protease inhibitors was also significant.
Figure 8
Figure 8. The impact of protease inhibitors on the activity of extracellular proteases.
Supernatants from the wild-type strains (WT) and their isogenic sarA mutants with (SPI) and without (S) protease inhibitors were harvested from overnight cultures and standardized with respect to each other prior to zymographic analysis using both casein (top) and gelatin gels (bottom). Based on relative activity with casein vs. gelatin, molecular size, and known polymorphisms within the corresponding genes/proteins , the presumed identity of specific proteases are SspA (1), aureolysin (2), ScpA (3) and SspB (4). The identity of other proteases remains unknown.
Figure 9
Figure 9. Role of sarA in production of the polysaccharide intracellular adhesin (PIA).
PIA was isolated from each of the wild-type strains (WT) and their isogenic sarA mutants (S) and immunoblotted using anti-PIA serum. A UAMS-1 ica mutant was included as a negative control. Upper and lower rows are duplicate samples from each strain.
Figure 10
Figure 10. Impact of sarA on extracellular nucleases.
The production of extracellular nucleases was assessed in the wild-type strains (WT) and their isogenic sarA mutants using DNase agar.
Figure 11
Figure 11. Epistatic relationship between sarA and agr in nuclease production.
Biofilm formation and production of extracellular nucleases was assessed using DNase agar in the indicated wild-type (WT) strains and their isogenic sarA (S), agr (A), and sarA/agr (SA) mutants with (SC) and without complementation of the sarA defect.
Figure 12
Figure 12. Activity of UAMS-1 nuclease genes.
Nuclease activity was assessed using DNase agar in UAMS-1 (WT) and its sarA mutant and in derivatives of each of these strains carrying mutations in SA0746 (nuc1) and/or SA1160 (nuc2).
Figure 13
Figure 13. Impact of nuclease genes on biofilm formation.
Biofilm formation was assessed in UAMS-1 (WT) and its sarA mutant (S) and in derivatives of each of these strains carrying mutations in nuc1 (n1), nuc2 (n2), or both nuc1 and nuc2 (n12) with and without plasma coating of the substrate. Results are shown as the mean ± the standard deviation of 6 replicate samples. Statistical analysis confirmed a significant difference between UAMS-1 (WT) and the isogenic nuc1, nuc2 and nuc1/nuc2 mutants in the absence of plasma coating and between the sarA mutant (S) and its isogenic nuc1/nuc2 mutant in the presence of plasma coating.
Figure 14
Figure 14. Expression of asp23 and sarS in clinical isolates.
RNA was isolated from each of the indicated strains during the exponential (E) and post-exponential (PE) growth phases and the amounts of the asp23 and sarS transcripts determined by qRT-PCR. Values obtained with RN6390 exponential phase cultures were set to 1.0 with the results observed with other strains shown relative to this value. Results are shown as the mean ± the standard deviation of duplicate samples. Statistical analysis confirmed a significant difference between RN6390 and each of the other strains in the context of both asp23 and sarS during both the exponential and post-exponential growth phases.
Figure 15
Figure 15. Impact of sarA on biofilm formation in isolates of other USA clonal lineages.
Biofilm formation was assessed in wild-type strains (WT) from each of eight USA clonal lineages (numerical designations refer to USA clonal lineage) and their corresponding sarA mutants (S). Results are shown as the mean ± the standard deviation of 6 replicate samples. Statistical analysis confirmed a significant difference between each wild-type strain and its isogenic sarA mutant.

References

    1. Brady RA, Leid JG, Calhoun JH, Costerton JW, Shirtliff ME. Osteomyelitis and the role of biofilms in chronic infection. FEMS Immunol. Med Microbiol. 2008;52:13–22. - PubMed
    1. O'Gara JP. ica and beyond: biofilm mechanisms and regulation in Staphylococcus epidermidis and Staphylococcus aureus. FEMS Microbiol Lett. 2007;270:179–188. - PubMed
    1. Coelho LR, Souza RR, Ferreira FA, Guimarães MA, Ferreira-Carvalho BT, et al. agr RNAIII divergently regulates glucose-induced biofilm formation in clinical isolates of Staphylococcus aureus. Microbiology. 2008;154:3480–3490. - PubMed
    1. Kong KF, Vuong C, Otto M. Staphylococcus quorum sensing in biofilm formation and infection. Int J Med Microbiol. 2006;296:133–139. - PubMed
    1. Vuong C, Saenz HL, Götz F, Otto M. Impact of the agr quorum-sensing system on adherence to polystyrene in Staphylococcus aureus. J Infect Dis. 2000;182:1688–1693. - PubMed

Publication types

MeSH terms