

Microspectroscopy of spectral biomarkers associated with human corneal stem cells
- PMID: 20520745
- PMCID: PMC2879290
Microspectroscopy of spectral biomarkers associated with human corneal stem cells
Abstract
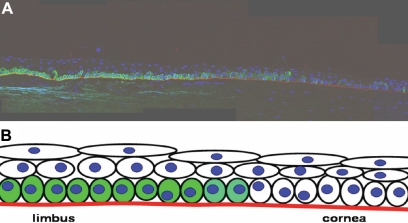
Purpose: Synchrotron-based radiation (SRS) Fourier-transform infrared (FTIR) microspectroscopy potentially provides novel biomarkers of the cell differentiation process. Because such imaging gives a "biochemical-cell fingerprint" through a cell-sized aperture, we set out to determine whether distinguishing chemical entities associated with putative stem cells (SCs), transit-amplifying (TA) cells, or terminally-differentiated (TD) cells could be identified in human corneal epithelium.
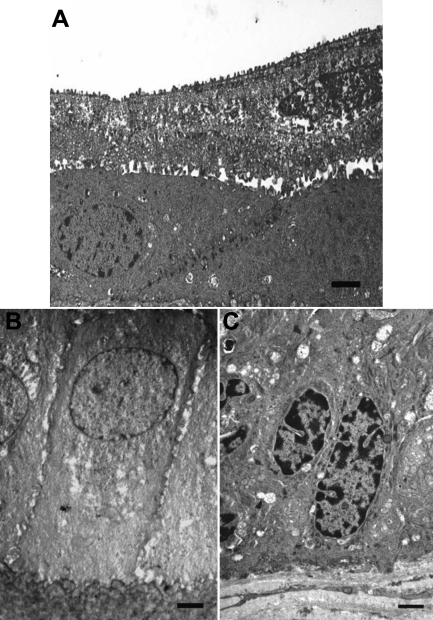
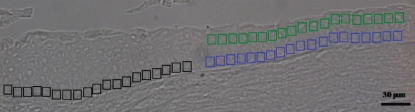
Methods: Desiccated cryosections (10 microm thick) of cornea on barium fluoride infrared transparent windows were interrogated using SRS FTIR microspectroscopy. Infrared analysis was performed through the acquisition of point spectra or image maps.
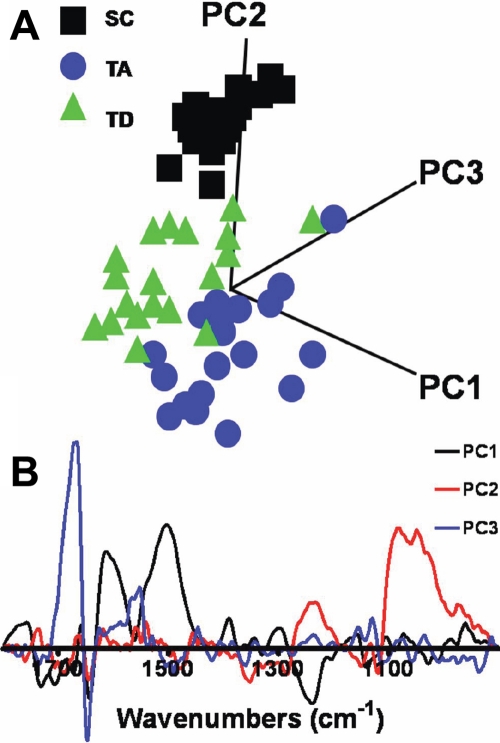
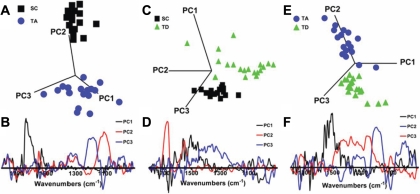
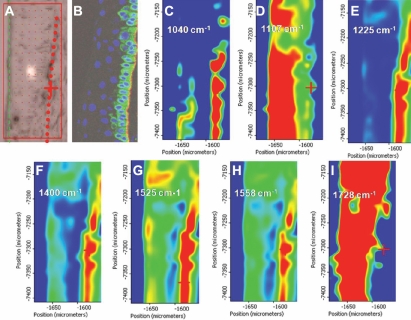
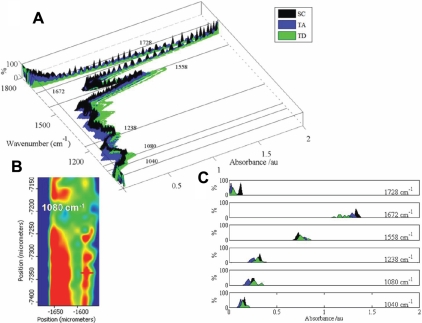
Results: Point spectra were subjected to principal component analysis (PCA) to identify distinguishing chemical entities. Spectral image maps to highlight SCs, TA cells, and TD cells of the cornea were then generated. Point spectrum analysis using PCA highlighted remarkable segregation between the three cell classes. Discriminating chemical entities were associated with several spectral differences over the DNA/RNA (1,425-900 cm(-1)) and protein/lipid (1,800-1480 cm(-1)) regions. Prominent biomarkers of SCs compared to TA cells and/or TD cells were 1,040 cm(-1), 1,080 cm(-1), 1,107 cm(-1), 1,225 cm(-1), 1,400 cm(-1), 1,525 cm(-1), 1,558 cm(-1), and 1,728 cm(-1). Chemical entities associated with DNA/RNA conformation (1,080 cm(-1) and 1,225 cm(-1)) were associated with SCs, whereas protein/lipid biochemicals (1,558 cm(-1) and 1,728 cm(-1)) most distinguished TA cells and TD cells.
Conclusions: SRS FTIR microspectroscopy can be employed to identify differential spectral biomarkers of SCs, TA cells, and/or TD cells in human cornea. This nondestructive imaging technology is a novel approach to characterizing SCs in situ.
Figures
Similar articles
-
Sub-cellular spectrochemical imaging of isolated human corneal cells employing synchrotron radiation-based Fourier-transform infrared microspectroscopy.Analyst. 2013 Jan 7;138(1):240-8. doi: 10.1039/c2an36197c. Epub 2012 Nov 15. Analyst. 2013. PMID: 23152953
-
Evidence for a stem-cell lineage in corneal squamous cell carcinoma using synchrotron-based Fourier-transform infrared microspectroscopy and multivariate analysis.Analyst. 2010 Dec;135(12):3120-5. doi: 10.1039/c0an00507j. Epub 2010 Oct 1. Analyst. 2010. PMID: 20886154
-
Characterization of putative stem cell populations in the cornea using synchrotron infrared microspectroscopy.Invest Ophthalmol Vis Sci. 2006 Jun;47(6):2417-21. doi: 10.1167/iovs.05-1254. Invest Ophthalmol Vis Sci. 2006. PMID: 16723451
-
Synchrotron Infrared Microspectroscopy for Stem Cell Research.Int J Mol Sci. 2022 Aug 30;23(17):9878. doi: 10.3390/ijms23179878. Int J Mol Sci. 2022. PMID: 36077277 Free PMC article. Review.
-
Vibrational Spectroscopy for In Vitro Monitoring Stem Cell Differentiation.Molecules. 2020 Nov 26;25(23):5554. doi: 10.3390/molecules25235554. Molecules. 2020. PMID: 33256146 Free PMC article. Review.
Cited by
-
The characterisation of pluripotent and multipotent stem cells using Fourier transform infrared microspectroscopy.Int J Mol Sci. 2013 Aug 26;14(9):17453-76. doi: 10.3390/ijms140917453. Int J Mol Sci. 2013. PMID: 24065090 Free PMC article. Review.
-
Multimodal imaging quality control of epithelia regenerated with cultured human donor corneal limbal epithelial stem cells.Sci Rep. 2017 Jul 11;7(1):5154. doi: 10.1038/s41598-017-05486-8. Sci Rep. 2017. PMID: 28698576 Free PMC article.
-
Intraocular Pressure Induced Retinal Changes Identified Using Synchrotron Infrared Microscopy.PLoS One. 2016 Oct 6;11(10):e0164035. doi: 10.1371/journal.pone.0164035. eCollection 2016. PLoS One. 2016. PMID: 27711151 Free PMC article.
-
Corneal epithelialisation on surface-modified hydrogel implants: artificial cornea.J Mater Sci Mater Med. 2011 Mar;22(3):663-70. doi: 10.1007/s10856-011-4244-4. Epub 2011 Feb 2. J Mater Sci Mater Med. 2011. PMID: 21287242
-
Across the spectrum: integrating multidimensional metal analytics for in situ metallomic imaging.Metallomics. 2019 Jan 23;11(1):29-49. doi: 10.1039/c8mt00235e. Metallomics. 2019. PMID: 30499574 Free PMC article. Review.
References
-
- German MJ, Pollock HM, Zhao B, Tobin MJ, Hammiche A, Bentley A, Cooper LJ, Martin FL, Fullwood NJ. Characterization of putative stem cell populations in the cornea using synchrotron infrared microspectroscopy. Invest Ophthalmol Vis Sci. 2006;47:2417–21. - PubMed
-
- Walsh MJ, Fellous TG, Hammiche A, Lin W-R, Fullwood NJ, Grude O, Bahrami F, Nicholson JM, Cotte M, Susini J, Pollock HM, Brittan M, Martin-Hirsch PL, Alison MR, Martin FL. Fourier transform infrared microspectroscopy identifies symmetric PO2- modifications as a marker of the putative stem cell region of human intestinal crypts. Stem Cells. 2008;26:108–18. - PubMed
-
- Hall PA, Watt FM. Stem cells: the generation and maintenance of cellular diversity. Development. 1989;106:619–33. - PubMed
-
- Davanger M, Evensen A. Role of the pericorneal papillary structure in renewal of corneal epithelium. Nature. 1971;229:560–1. - PubMed
Publication types
MeSH terms
Substances
Grants and funding
LinkOut - more resources
Full Text Sources
Medical