. 2010 May 25;8(5):e1000379.
doi: 10.1371/journal.pbio.1000379.

Functional heterogeneity of embryonic stem cells revealed through translational amplification of an early endodermal transcript

Affiliations

Functional heterogeneity of embryonic stem cells revealed through translational amplification of an early endodermal transcript

Maurice A Canham et al. PLoS Biol. .

Abstract

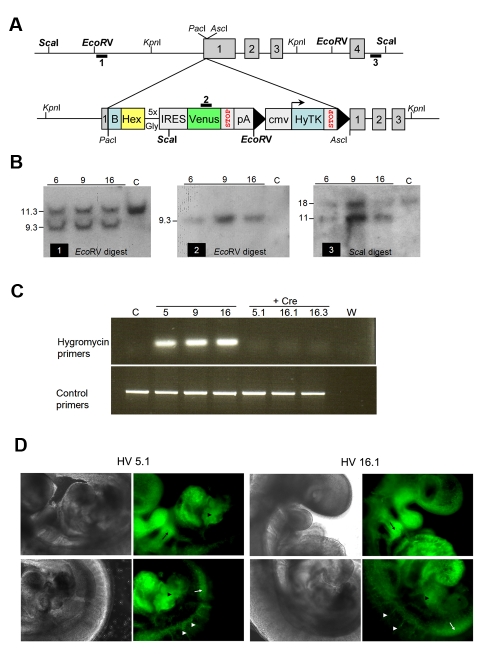
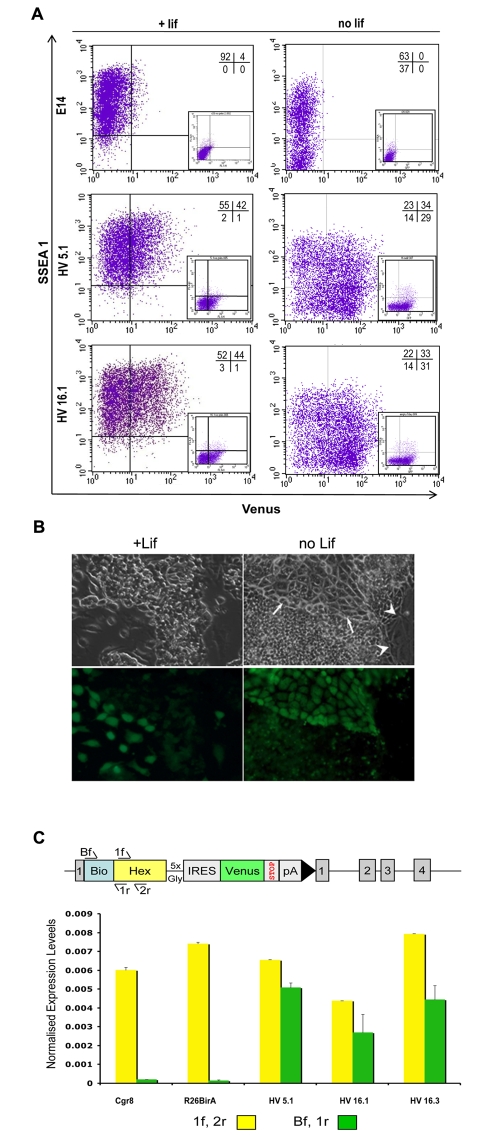
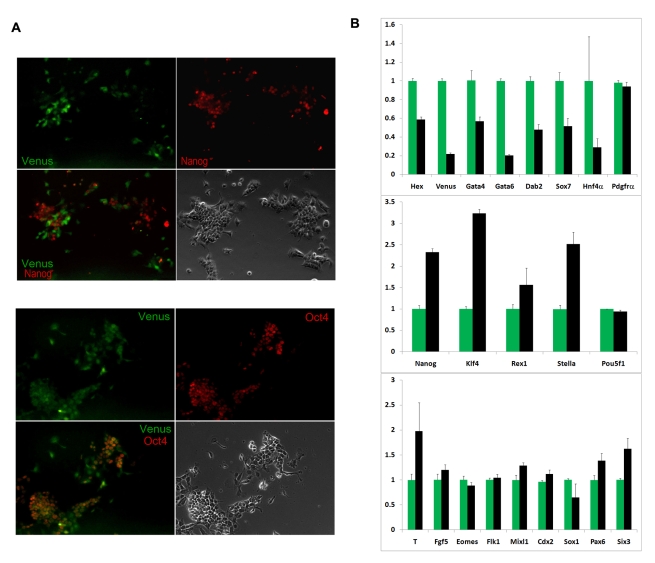
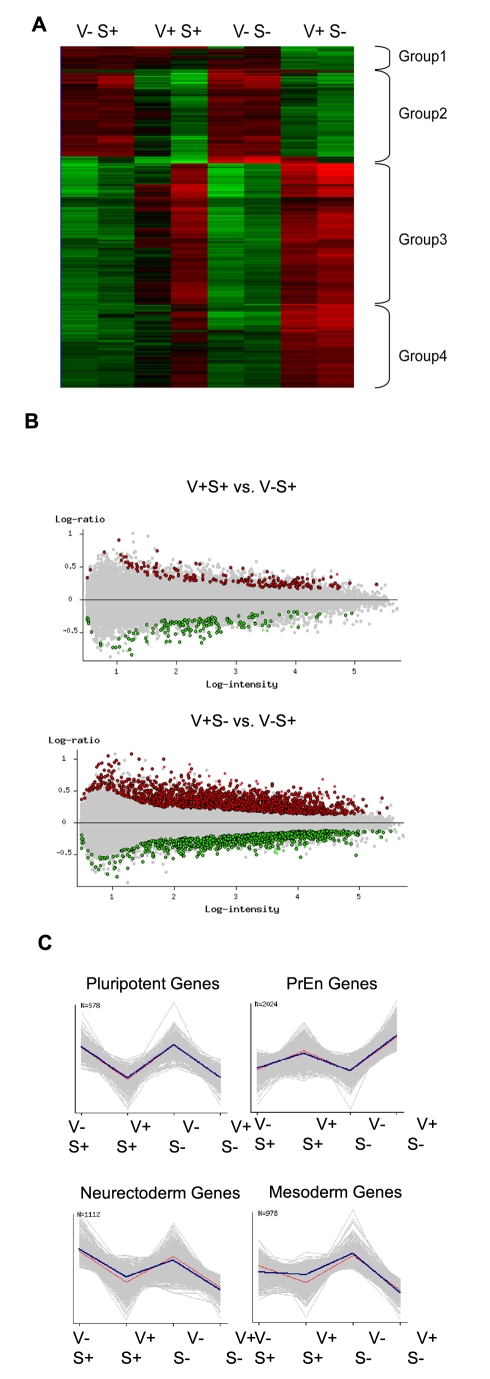
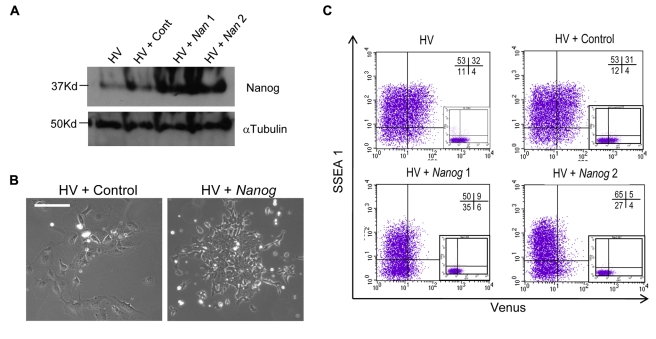
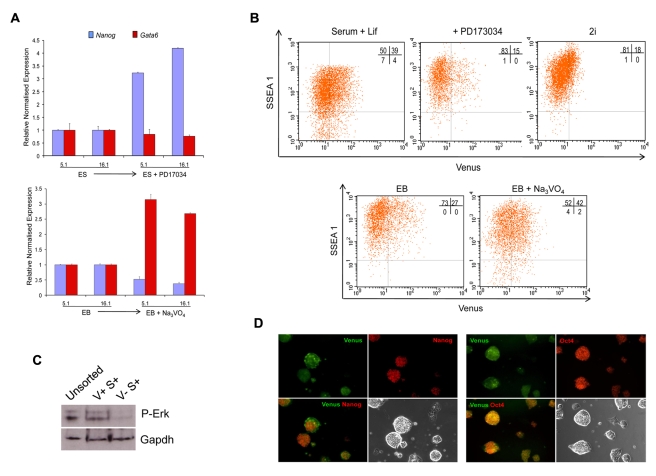
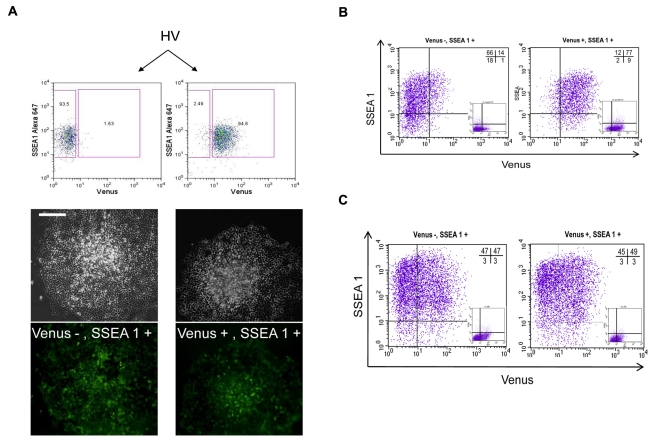
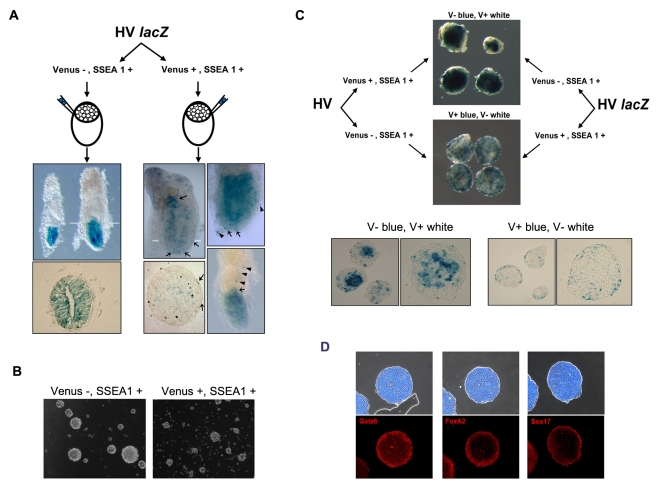
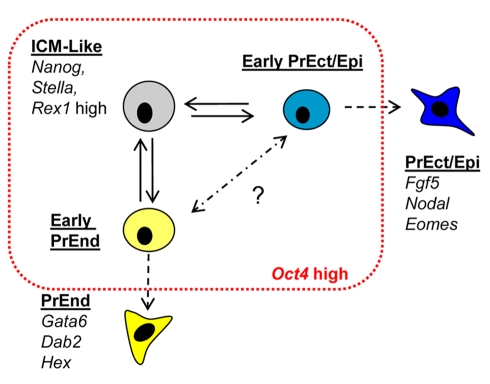
ES cells are defined as self-renewing, pluripotent cell lines derived from early embryos. Cultures of ES cells are also characterized by the expression of certain markers thought to represent the pluripotent state. However, despite the widespread expression of key markers such as Oct4 and the appearance of a characteristic undifferentiated morphology, functional ES cells may represent only a small fraction of the cultures grown under self-renewing conditions. Thus phenotypically "undifferentiated" cells may consist of a heterogeneous population of functionally distinct cell types. Here we use a transgenic allele designed to detect low level transcription in the primitive endoderm lineage as a tool to identify an immediate early endoderm-like ES cell state. This reporter employs a tandem array of internal ribosomal entry sites to drive translation of an enhanced Yellow Fluorescent Protein (Venus) from the transcript that normally encodes for the early endodermal marker Hex. Expression of this Venus transgene reports on single cells with low Hex transcript levels and reveals the existence of distinct populations of Oct4 positive undifferentiated ES cells. One of these cells types, characterized by both the expression of the Venus transgene and the ES cells marker SSEA-1 (V(+)S(+)), appears to represent an early step in primitive endoderm specification. We show that the fraction of cells present within this state is influenced by factors that both promote and suppress primitive endoderm differentiation, but conditions that support ES cell self-renewal prevent their progression into differentiation and support an equilibrium between this state and at least one other that resembles the Nanog positive inner cell mass of the mammalian blastocysts. Interestingly, while these subpopulations are equivalently and clonally interconvertible under self-renewing conditions, when induced to differentiate both in vivo and in vitro they exhibit different behaviours. Most strikingly when introduced back into morulae or blastocysts, the V(+)S(+) population is not effective at contributing to the epiblast and can contribute to the extra-embryonic visceral and parietal endoderm, while the V(-)S(+) population generates high contribution chimeras. Taken together our data support a model in which ES cell culture has trapped a set of interconvertible cell states reminiscent of the early stages in blastocyst differentiation that may exist only transiently in the early embryo.


Conflict of interest statement

The authors have declared that no competing interests exist.

Figures

Figure 1
Figure 1. Targeting of the Hex locus with an amplified IRES Venus reporter.
(A) Schematic representation of the gene targeting strategy. Hex cDNA tagged with a recognition site for the bacterial BirA ligase (B), followed by an artificial IRES sequence composed of a tandem array of reiterated 9 bp elements from the Gtx promoter and DNA encoding the fluorescent reporter, Venus, was inserted into the first exon of the Hex locus. (B) Southern blot analysis of targeted cell lines. Each blot depicted with an indication of the specific probe and digest. Genomic DNA digested with EcoRV was hybridised with either probe 1 to reveal WT (11.3 kb) or targeted (9.3 kb) bands, or probe 2 to produce a 9.3 kb band representing a single integration only in the Hex locus. Genomic DNA was also digested with ScaI and hybridised with probe 3 to reveal WT (17.8 kb) or targeted bands (11.5 kb). Genomic DNA from wild-type E14 cells is in the lanes labelled with a C. (C) Removal of selection cassette by transfection with the Cre recombinase. Following removal of the selection cassette through identification of GancR clones a PCR based strategy was used to confirm excision. Primers specific for the hygromycin resistance gene were used alongside control primers to sites in the Hex promoter region. (D) HV reporter is faithful to Hex expression in chimeras. ES cells from two HV clones (5.1 and 16.1) were used to generate chimeras by morula aggregation. Embryos were obtained at E9.5 and imaged with fluorescence microscopy. Images show expression of Venus derived from two different clones in the thyroid (black arrow), intersomitic vessels (white arrowheads), the dorsal aorta region (white arrow), and liver primordium (black arrowhead).
Figure 2
Figure 2. Expression of Venus in a subpopulation of SSEA 1 positive HV cells under self-renewing conditions.
(A) Flow cytometry of two independent HV clones (HV 5.1 and HV 16.1) cultured either under self-renewing conditions or in the absence of LIF show the presence of a subpopulation of cells positive for Venus and/or the ES cell surface marker SSEA-1. Gates for expression of Venus and the presence of SSEA 1 were based on unstained E14 ES cells. Upon the removal of LIF for 3 d, the percentage of cells negative for SSEA 1 increased in both HV clones and the E14 cell line. (B) Fluorescence microscopy of the HV cell line in the presence or absence of LIF. Cultures were differentiated as (A). Note the brighter intensity of Venus in the tightly apposed pavement-like cells in the LIF negative culture (white arrows). Venus expression is absent from giant flat cells (white arrowheads). (C) Expression of the Venus transgene is similar to the low-level expression of the Hex cDNA. RNA was prepared from self-renewing cultures of three HV clones, parental R26BirA cells, and Cgr8 cells. Quantitative PCR analysis was carried out to monitor levels of mRNA derived from both targeted and untargeted alleles of Hex (1f, 2r) or targeted allele only (Bf, 1r). The schematic diagram depicts the different primers used. Values for each primer set used were normalised to the levels of Actin value obtained for each sample.
Figure 3
Figure 3. Venus positive population may represent an early state in PrEn differentiation.
(A) Venus positive cells express Oct4, but not Nanog. Colonies of HV cells were fixed and immunostained for both Oct4 and Nanog. Primary antibodies specific to Oct4 and Nanog were detected using Alexa 568 conjugated secondary antibodies (red). Images include Venus fluorescence, antibody staining, overlay of Venus and antibody, and bright field for each cell line and the indicated antibodies. (B) Quantitative RT-PCR showing the relative expression of endodermal and pluripotency genes between Venus positive and negative cells obtained from the SSEA-1 positive fractions of two HV clones following flow cytometry. Quantitative PCR analysis was performed to compare transcript levels of Venus with PrEn (Hex, Gata4, Gata6, Dab2, Sox7, Hnf4α, and Pdgfrα), pluripotency (Nanog, Klf4, Rex1, Stella, and Pou5f1) and other lineage (T, Fgf5, Eomes, Flk1, Mixl1, Cdx2, Sox1, Pax6, and Six3) markers in purified cell fractions. Venus positive fractions are represented as green bars and Venus negative black bars. Transcript levels were normalised to the TBP value obtained for each sample. Normalised values are related to the level obtained for the Venus positive fraction in each case.
Figure 4
Figure 4. Microarray analyses of purified HV fractions.
Analyses of global gene expression in fractions defined by expression of the Venus transgene and SSEA-1. HV ES cells grown under self-renewing conditions were fractionated by flow cytometry into four fractions based on Venus (V) and SSEA-1 (S) expression. RNA was isolated from the following fractions: V,S+; V+,S+; V,S; V+,S and hybridised to a NIA Mouse 44K Microarray v2.1. (A) Heat map illustrating hierarchical clustering of differentially expressed genes identified in a pair-wise analysis of all four fractions. Significant changes in the expression of 2,169 genes (FDR <0.05) resulted in the identification of three to four expression groups, depending on whether clonal variation is taken into account. (B) Pair-wise comparisons (FDR <0.05, >1.5-fold expression levels) of the two ES cell populations, V+S+ and VS+ depicted alongside the comparison between differentiated PrEn V+S fraction and the Venus negative ES cell fraction (VS+). (C) Gene expression changes characteristic of PrEn, ICM/pluripotency, neurectoderm, and mesoderm genes (expression of individual markers are included as supplementary, Figure S3). Plots are shown comparing mean log intensity values of genes among the four populations. Error bars (see supplementary data) represent standard deviation between expression levels in independent clonal lines of HV cells.
Figure 5
Figure 5. Nanog expression suppresses the Venus positive early PrEn precursor state.
(A) Western blot demonstrating Nanog overexpression from the CAG promoter in two clones of HV cells. Control clones were derived in parallel with an empty vector. (B) Nanog overexpression makes HV ES cells resistant to LIF withdrawal. Nanog overexpressing and control cell lines were cultured in the absence of LIF for 10 d and assessed for ES cell-like morphology. (C) Nanog overexpression suppresses the V+S+ population. Expression of Venus and SSEA-1 were quantitated by flow cytometry in two independent clonal lines and compared to both control and parental cells.
Figure 6
Figure 6. Manipulation of FGF signalling alters the levels of Venus expression.
(A) FGF signalling modulates Nanog and Gata6 expression in HV cells. Inhibition of FGF signalling with PD173074 (10 nM) increases the levels of Nanog gene expression in two HV clones while slightly reducing low-level Gata6 expression. Conversely, potentiation of this pathway with the phosphatase inhibitor Sodium Vanadate (50 µM) in aggregate cultures (EB + Na3VO4) reduces the levels of Nanog while increasing those of Gata6. Transcript levels were assessed by qPCR and normalised to the TBP value obtained for each sample. Normalised values are related to the untreated sample for each clone. (B) The V+S+ fraction responds to FGF signalling. Cells grown as in (A) were subject to flow cytometry. Inhibition of the FGF pathway by PD173074 or culture in 2i reduces the extent of Venus expression, while Sodium Vanadate stimulates it. (C) Measurement of Phospho-Erk levels in V+S+ and VS+ fractions shows an enrichment of activated Erk with Venus positive ES cells. (D) Venus cells persist in 2i culture. Immunocytochemistry of HV cells in 2i culture show the persistence of some Venus cells that have lower levels of Nanog expression, whereas Venus and Oct4 co-express.
Figure 7
Figure 7. Reversibility of Venus positive and negative populations.
(A) Reconstitution of Venus distribution from single V+S+ or V+S cells. HV cells cultured under self-renewing conditions were subjected to flow cytometry to separate Venus positive and negative subpopulations within the SSEA-1 positive fraction. A sample purity check is shown in the top panel. Representative clones produced from each fraction plated at clonal density and imaged by fluorescence microscopy are shown. (B) Flow cytometry on cells from each fraction 24 h after plating. (C) Flow cytometry on cells plated at single cell density in 96 well plates from each sorted fraction. Cells were cultured for 10 d following plating and 12 wells derived from each fraction were subjected to flow cytometry. All appeared identical and a representative image of each is shown in the figure.
Figure 8
Figure 8. Functional differences between purified Venus positive and negative ES cells.
(A) V+S+ and VS+ ES cells contribute differently to embryos in morula aggregation. HV cell lines constitutively expressing β-Geo from the CAG promoter (HV lacZ) were fractionated into V+S+ and VS+ and their ability to contribute to chimeric embryos assayed by morula aggregation. Within an hour of separation by flow cytometry, cells from each fraction were aggregated with wild-type F1 morulae. Following transfer into pseudo-pregnant mice, resultant embryos were harvested at E6.5 and subjected to X-gal staining. Representative embryos derived from each population are shown. White bars indicate the plane of section shown in the panel beneath specific embryos. Black arrows show the presence of LacZ positive cells in the visceral endoderm. Black arrowheads show the presence of LacZ positive cells in the parietal endoderm. (B) Only VS+ fraction forms normal spherical EBs. Fractionated HIV ES cells were cultured for 4 d as aggregates in the absence of LIF. (C) V+S+ cells contribute to the presumed visceral endoderm in chimeric EBs. When V+S+ cells were recombined with VS+ cells immediately following sorting, they formed normal EBs and the V+S+ cells move preferentially to the outside to form the presumptive visceral endoderm. The VS+ fraction of HVlacZ cells was combined with an equivalent number of V+S+ HV cells (top) or V+S+ HVlacZ cells recombined with VS+ HV (bottom). EBs were stained with X-gal and representative sets shown. The bottom panel shows sections through representative chimeric EBs. (D) Sections of EBs grown under the same conditions as in part (C), showing that the outer layer consists of visceral endoderm as marked by Gata6, FoxA2, and Sox17 immunostaining (shown as red). Bright field/DAPI composites of each section are shown above.
Figure 9
Figure 9. A model for the dynamic equilibrium that exists in ES cell culture.
The schematic diagram depicts the potential cell subtypes that make up ES cell culture. The red line represents the boundary established by the culture conditions. We depict an early PrEn precursor cell defined by the V+S+ phenotype in light yellow, expressing low levels of PrEn determinants such as Hex and Gata6. This cell type is shown in equilibrium with an ICM-like cell. A hypothetical PrEc cell implied by the findings of others is indicated in blue.

Similar articles

Cited by

References

    1. Evans M. J, Kaufman M. H. Establishment in culture of pluripotential cells from mouse embryos. Nature. 1981;292:154–156. - PubMed
    1. Martin G. R. Isolation of a pluripotent cell line from early mouse embryos cultured in medium conditioned by teratocarcinoma stem cells. Proc Natl Acad Sci U S A. 1981;78:7634–7638. - PMC - PubMed
    1. Smith A. G. Embryo-derived stem cells: of mice and men. Annu Rev Cell Dev Biol. 2001;17:435–462. - PubMed
    1. Chambers I, Smith A. Self-renewal of teratocarcinoma and embryonic stem cells. Oncogene. 2004;23:7150–7160. - PubMed
    1. Cui L, Johkura K, Yue F, Ogiwara N, Okouchi Y, et al. Spatial distribution and initial changes of SSEA-1 and other cell adhesion-related molecules on mouse embryonic stem cells before and during differentiation. J Histochem Cytochem. 2004;52:1447–1457. - PMC - PubMed

Publication types

MeSH terms