

Front instabilities and invasiveness of simulated 3D avascular tumors
- PMID: 20520818
- PMCID: PMC2877086
- DOI: 10.1371/journal.pone.0010641
Front instabilities and invasiveness of simulated 3D avascular tumors
Abstract
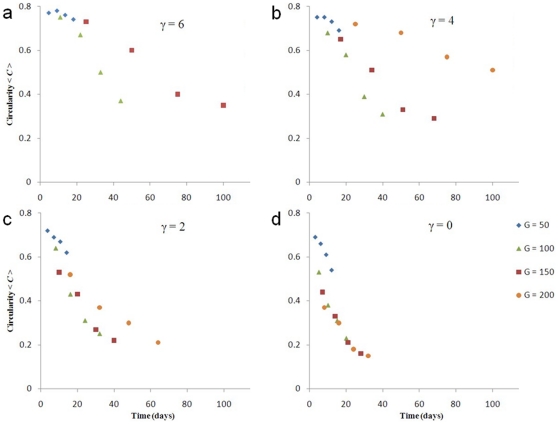
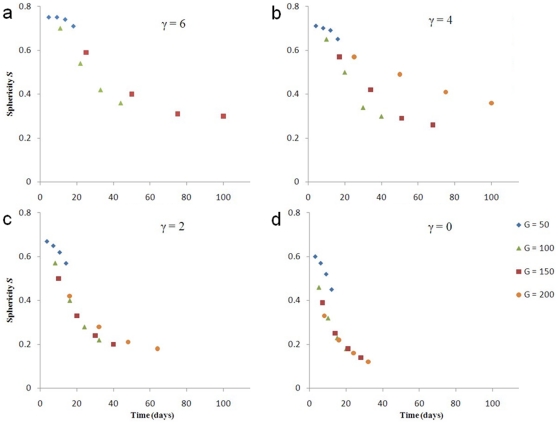
We use the Glazier-Graner-Hogeweg model to simulate three-dimensional (3D), single-phenotype, avascular tumors growing in an homogeneous tissue matrix (TM) supplying a single limiting nutrient. We study the effects of two parameters on tumor morphology: a diffusion-limitation parameter defined as the ratio of the tumor-substrate consumption rate to the substrate-transport rate, and the tumor-TM surface tension. This initial model omits necrosis and oxidative/hypoxic metabolism effects, which can further influence tumor morphology, but our simplified model still shows significant parameter dependencies. The diffusion-limitation parameter determines whether the growing solid tumor develops a smooth (noninvasive) or fingered (invasive) interface, as in our earlier two-dimensional (2D) simulations. The sensitivity of 3D tumor morphology to tumor-TM surface tension increases with the size of the diffusion-limitation parameter, as in 2D. The 3D results are unexpectedly close to those in 2D. Our results therefore may justify using simpler 2D simulations of tumor growth, instead of more realistic but more computationally expensive 3D simulations. While geometrical artifacts mean that 2D sections of connected 3D tumors may be disconnected, the morphologies of 3D simulated tumors nevertheless correlate with the morphologies of their 2D sections, especially for low-surface-tension tumors, allowing the use of 2D sections to partially reconstruct medically-important 3D-tumor structures.
Conflict of interest statement
Figures
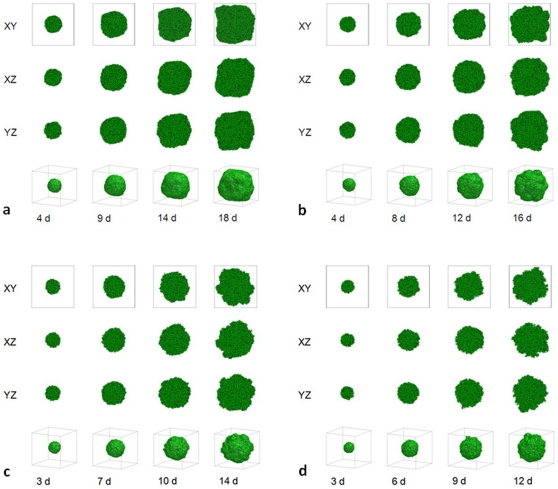
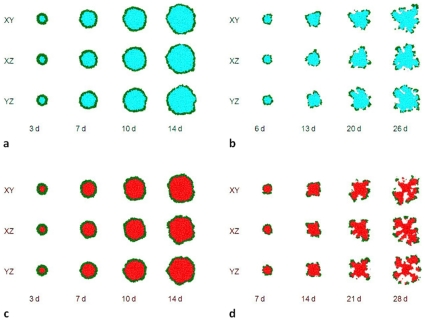
 . 2D sections of a 3D simulation along the XY (first row), XZ (second row) and YZ plane (third row). The developing tumor is initially spherical; it then becomes slightly irregular. Fourth row: 3D visualization of the same simulation. (b)
  . 2D sections of a 3D simulation along the XY (first row), XZ (second row) and YZ plane (third row). The developing tumor is initially spherical; it then becomes grooved. Fourth row: 3D visualization of the same simulation. (c)
  . 2D sections of a 3D simulation along the XY (first row), XZ (second row) and YZ plane (third row). The developing tumor is initially spherical; it then becomes grooved. Fourth row: 3D visualization of the same simulation. (d)
  . 2D sections of a 3D simulation along the XY (first row), XZ (second row) and YZ plane (third row). The developing tumor is initially spherical; it then becomes grooved with a rough surface. Fourth row: 3D visualization of the same simulation. The simulation time is indicated in days beneath each column, where 1 day = 400 MCS.
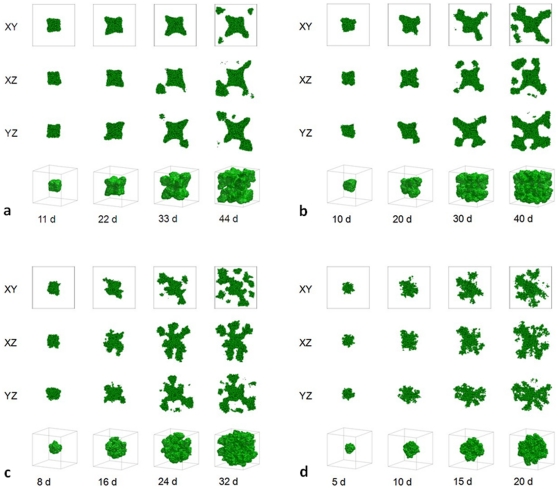
 . 2D sections of a 3D simulation along the XY (first row), XZ (second row) and YZ plane (third row). The developing tumor is initially compact; it then becomes dendritic. The disconnected parts in the last image connect to the backbone of the tumor out of the section plate. Fourth row: 3D visualization of the same simulation. (b)
  . 2D sections of a 3D simulation along the XY (first row), XZ (second row) and YZ plane (third row). The developing tumor is initially compact; it then becomes dendritic. The disconnected parts in the last two images connect to the backbone of the tumor out of the section plate. Fourth row: 3D visualization of the same simulation. (c)
  . 2D sections of a 3D simulation along the XY (first row), XZ (second row) and YZ plane (third row). The developing tumor is initially compact with a rough surface; it then becomes seaweed-like. The disconnected parts in the last two images connect to the backbone of the tumor out of the section plate. Fourth row: 3D visualization of the same simulation. (d)
  . 2D sections of a 3D simulation along the XY (first row), XZ (second row) and YZ plane (third row). The developing tumor is seaweed-like with a rough surface. The disconnected parts in the images connect to the backbone of the tumor out of the section plate. Fourth row: 3D visualization of the same simulation. The simulation time is indicated in days beneath each column, where 1 day = 400 MCS.
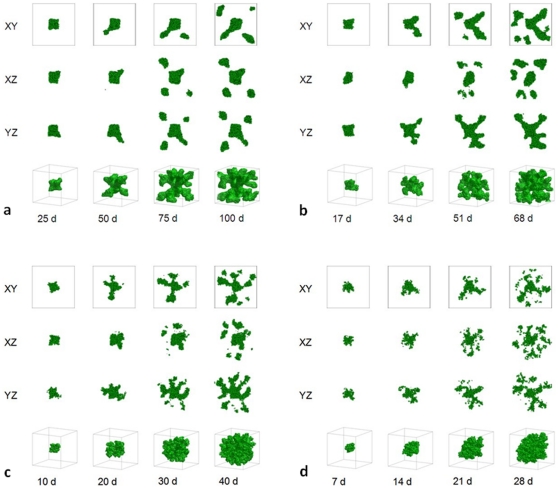
 . 2D sections of a 3D simulation along the XY (first row), XZ (second row) and YZ plane (third row). The developing tumor is initially compact; it then becomes dendritic. The disconnected parts in the last two images connect to the backbone of the tumor out of the section plate. Fourth row: 3D visualization of the same simulation. (b)
  . 2D sections of a 3D simulation along the XY (first row), XZ (second row) and YZ plane (third row). The developing tumor becomes dendritic. The disconnected parts in the last two images connect to the backbone of the tumor out of the section plate. Fourth row: 3D visualization of the same simulation. (c)
  . 2D sections of a 3D simulation along the XY (first row), XZ (second row) and YZ plane (third row). The developing tumor has a form intermediate between dendrite and seaweed. The disconnected parts in the images connect to the backbone of the tumor out of the section plate. Fourth row: 3D visualization of the same simulation. (d)
  . 2D sections of a 3D simulation along the XY (first row), XZ (second row) and YZ plane (third row). The developing tumor is seaweed-like. The disconnected parts in the images connect to the backbone of the tumor out of the section plate. Fourth row: 3D visualization of the same simulation. The simulation time is indicated in days beneath each column, where 1 day = 400 MCS.
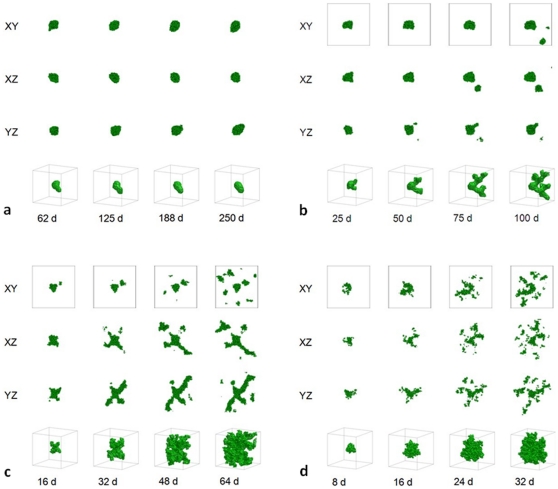
 . 2D sections of a 3D simulation along the XY plane. The developing tumor remains compact and ceases proliferating. We do not show 2D sections along the XZ and YZ planes because they are essentially indistinguishable from those along the XY plane. We do not show 3D visualization of the same simulation because it does not provide any new information about the simulated tumor. (b)
  . 2D sections of a 3D simulation along the XY (first row), XZ (second row) and YZ plane (third row). The developing tumor forms a truncated dendrite. The disconnected parts in the last image connect to the backbone of the tumor out of the section plate. Fourth row: 3D visualization of the same simulation. (c)
  . 2D sections of a 3D simulation along the XY (first row), XZ (second row) and YZ plane (third row). The developing tumor has a form intermediate between dendrite and seaweed, with thinner fingers. The disconnected parts in the images connect to the backbone of the tumor out of the section plate. Fourth row: 3D visualization of the same simulation. (d)
  . 2D sections of a 3D simulation along the XY (first row), XZ (second row) and YZ plane (third row). The developing tumor forms a seaweed. The disconnected parts in the images connect to the backbone of the tumor out of the section plate. Fourth row: 3D visualization of the same simulation. The simulation time is indicated in days beneath each column, where 1 day = 400 MCS.
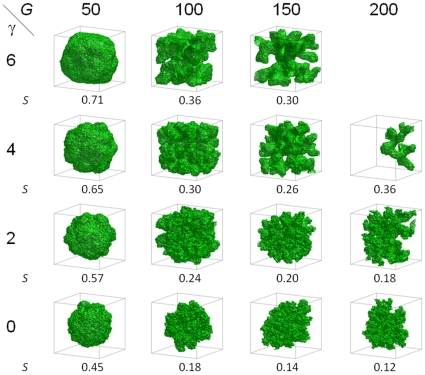
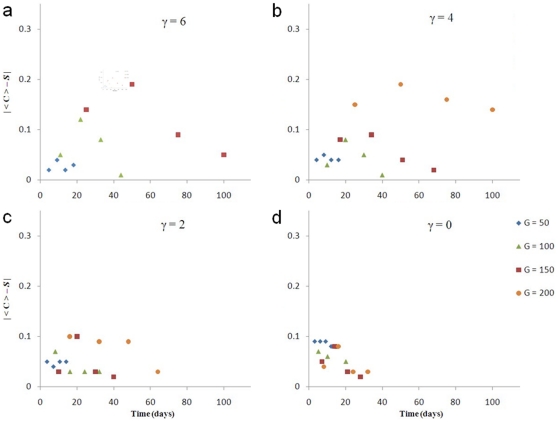
 is less than 0.02. The panel for
  and
and  is blank because the corresponding tumor never grows to this size.
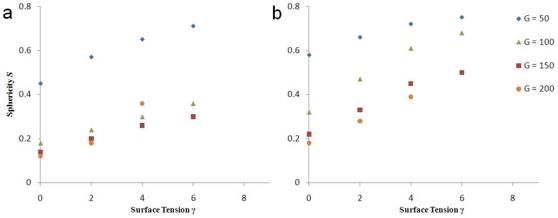
 , (b)
, (b)  , (c)
, (c)  , and (d)
  .
.
 , (b)
, (b)  , (c)
, (c)  , and (d)
  .
.
 , (b)
, (b)  , (c)
, (c)  , and (d)
  .
.
 . (b) 2D sections of 3D simulations with quiescence with
  . Green - proliferating cells, blue - quiescent cells. (c) 2D sections of 3D simulations with necrosis with
  . (d) 2D sections of 3D simulations with necrosis with
  . Green - proliferating cells, red - necrotic cells.
References
-
- Graner F, Glazier JA. Simulation of biological cell sorting using a two-dimensional extended Potts model. Phys Rev Lett. 1992;69:2013. - PubMed
-
- Glazier JA, Graner F. Simulation of the differential adhesion driven rearrangement of biological cells. Phys Rev E. 1993;47:2128. - PubMed
-
- Glazier JA, Balter A, Popławski NJ. Anderson ARA, Chaplain MAJ, Rejniak KA, editors. Magnetization to morphogenesis: a brief history of the Glazier-Graner-Hogeweg model. Single-Cell-Based Models in Biology and Medicine, Birkhäuser-Verlag. 2007. 79
-
- Chaturvedi R, Izaguirre JA, Huang C, Cickovski T, Virtue P, et al. Multi-model simulations of chicken limb morphogenesis. Lect Notes Comput Sci. 2003;2659:39.
Publication types
MeSH terms
Grants and funding
LinkOut - more resources
Full Text Sources
