

Effect of ligand binding on human D-amino acid oxidase: implications for the development of new drugs for schizophrenia treatment
- PMID: 20521334
- PMCID: PMC2923503
- DOI: 10.1002/pro.429
Effect of ligand binding on human D-amino acid oxidase: implications for the development of new drugs for schizophrenia treatment
Abstract
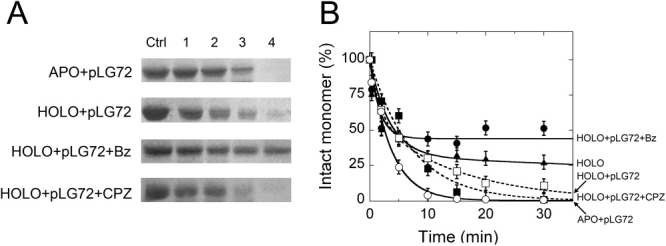
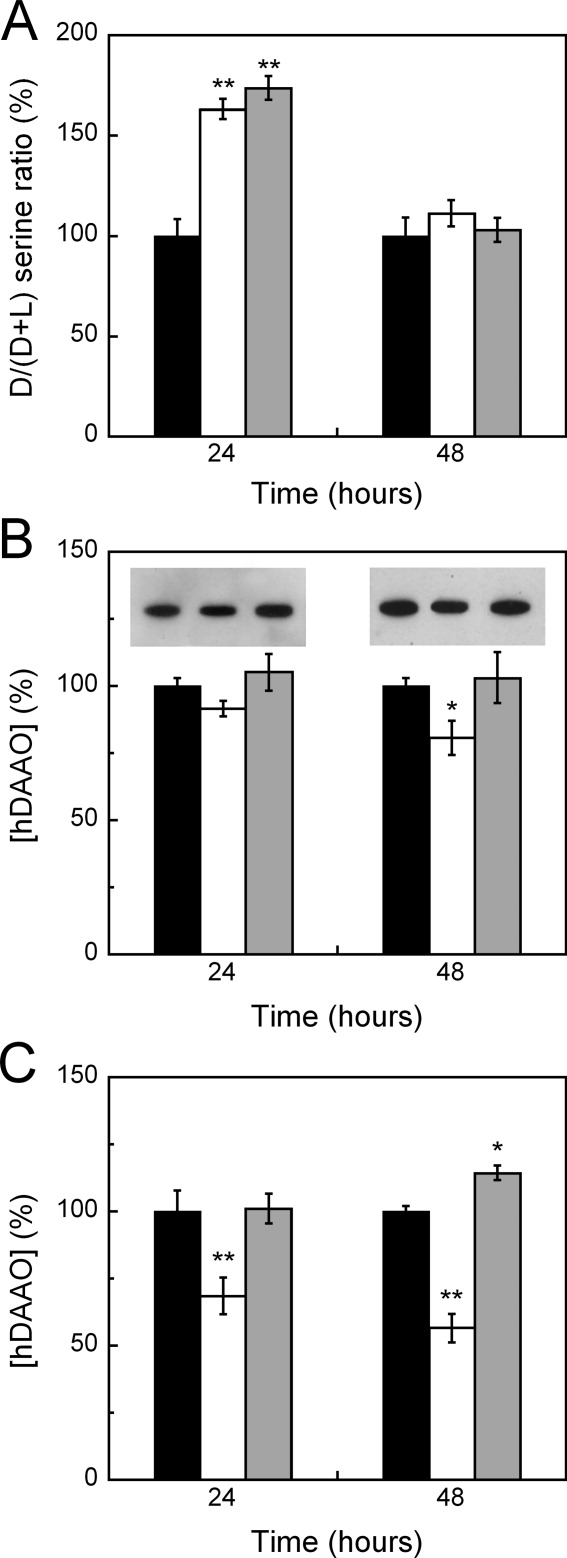
In human brain the flavoprotein D-amino acid oxidase (hDAAO) is responsible for the degradation of the neuromodulator D-serine, an important effector of NMDA-receptor mediated neurotransmission. Experimental evidence supports the concept that D-serine concentration increase by hDAAO inhibition may represent a valuable therapeutic approach to improve the symptoms in schizophrenia patients. This study investigated the effects on hDAAO conformation and stability of the substrate D-serine (or of the pseudo-substrate trifluoro-D-alanine), the FAD cofactor, and two inhibitors (benzoate, a classical substrate-competitive inhibitor and the drug chlorpromazine (CPZ), which competes with the cofactor). We demonstrated that all these compounds do not alter the interaction of hDAAO with its physiological partner pLG72. The ligands used affect the tertiary structure of hDAAO differently: benzoate or trifluoro-D-alanine binding increases the amount of the holoenzyme form in solution and stabilizes the flavoprotein, while CPZ binding favors a protein conformation resembling that of the apoprotein, which is more sensitive to degradation. Interestingly, the apoprotein form of hDAAO binds the substrate D-serine: this interaction increases FAD binding thus increasing the amount of active holoenzyme in solution. Benzoate and CPZ similarly modify the short-term cellular D-serine concentration but affect the cellular concentration of hDAAO differently. In conclusion, the different alteration of hDAAO conformation and stability by the ligands used represents a further parameter to take into consideration during the development of new drugs to cope schizophrenia.
Figures
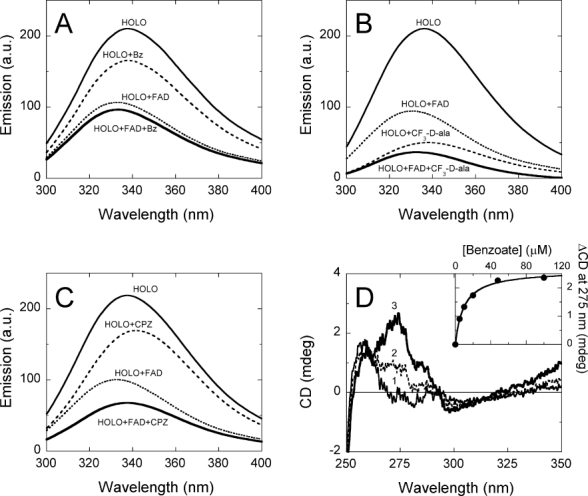
 , in the absence and
  , in the presence of 40 μM FAD) and after adding 0.1 mM benzoate (
 , in the absence and
  , in the presence of 40 μM FAD). (B) Comparison of protein fluorescence of hDAAO before and after adding 30 mM CF3-
 ) 4.8 μM benzoate; (3,
  ) 48 μM benzoate. Inset: change in CD signal at ≈275 nm at increasing benzoate concentrations.
References
-
- Oliet SH, Mothet JP. Regulation of N-methyl-d-aspartate receptors by astrocytic D-serine. Neuroscience. 2009;158:275–283. - PubMed
-
- Harrison PJ, Weinberger DR. Schizophrenia genes, gene expression, and neuropathology: on the matter of their convergence. Mol Psychiatry. 2005;10:40–68. - PubMed
-
- Ross CA, Margolis RL, Reading SA, Pletnikov M, Coyle JT. Neurobiology of schizophrenia. Neuron. 2006;52:139–153. - PubMed
Publication types
MeSH terms
Substances
LinkOut - more resources
Full Text Sources
Medical
Molecular Biology Databases
