

Cytidylyl and uridylyl cyclase activity of bacillus anthracis edema factor and Bordetella pertussis CyaA
- PMID: 20521845
- PMCID: PMC2951761
- DOI: 10.1021/bi100684g
Cytidylyl and uridylyl cyclase activity of bacillus anthracis edema factor and Bordetella pertussis CyaA
Abstract
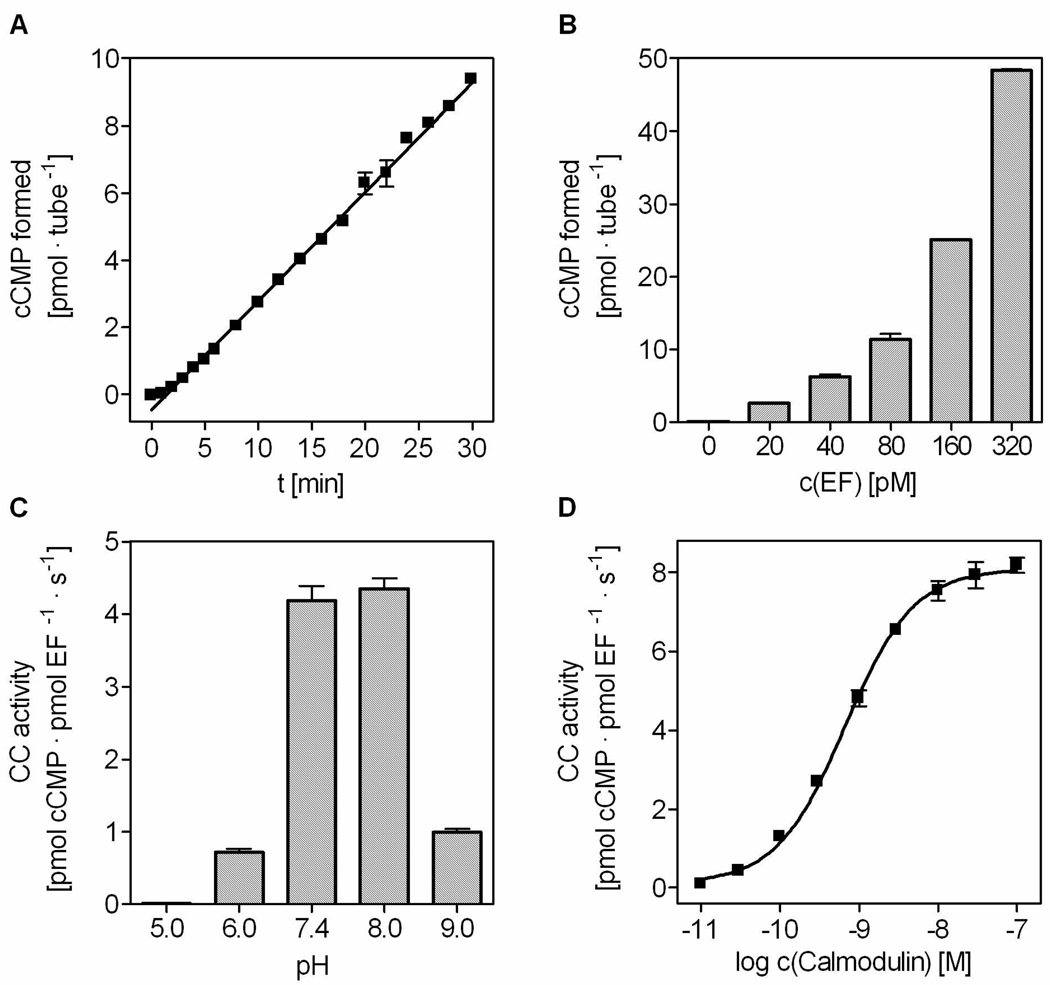
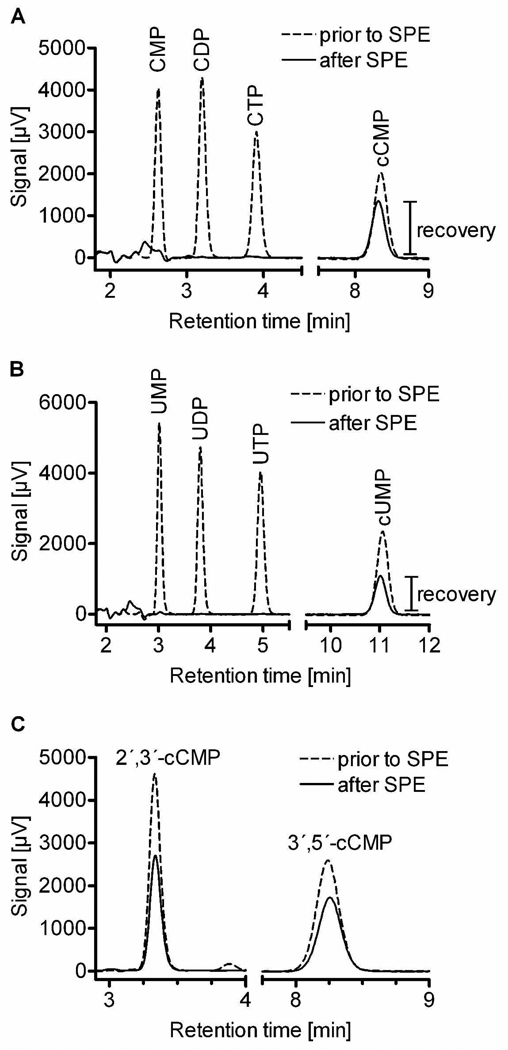
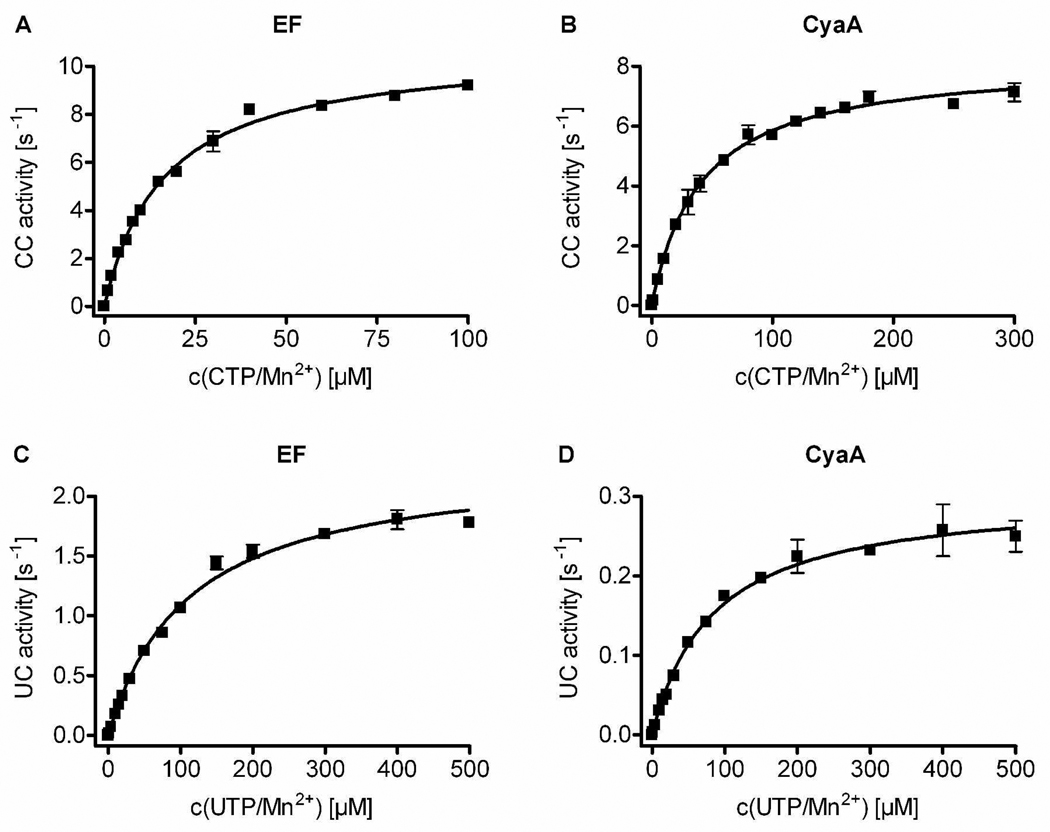
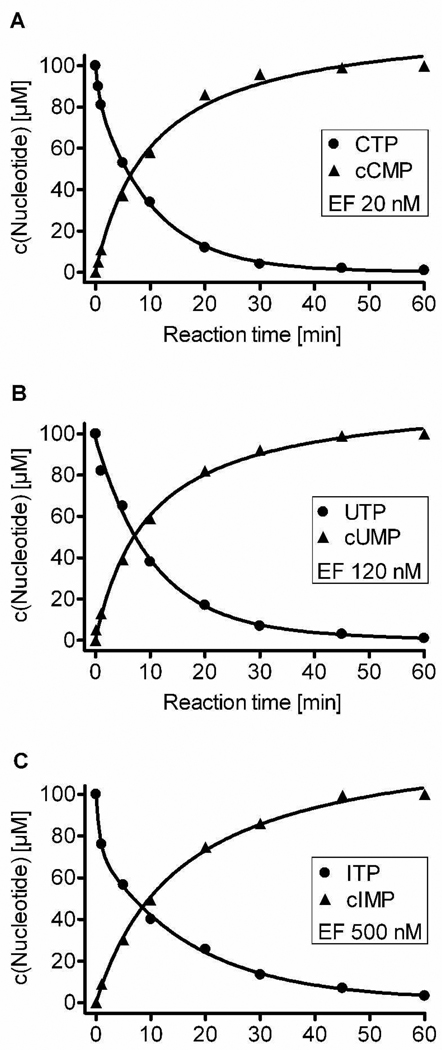
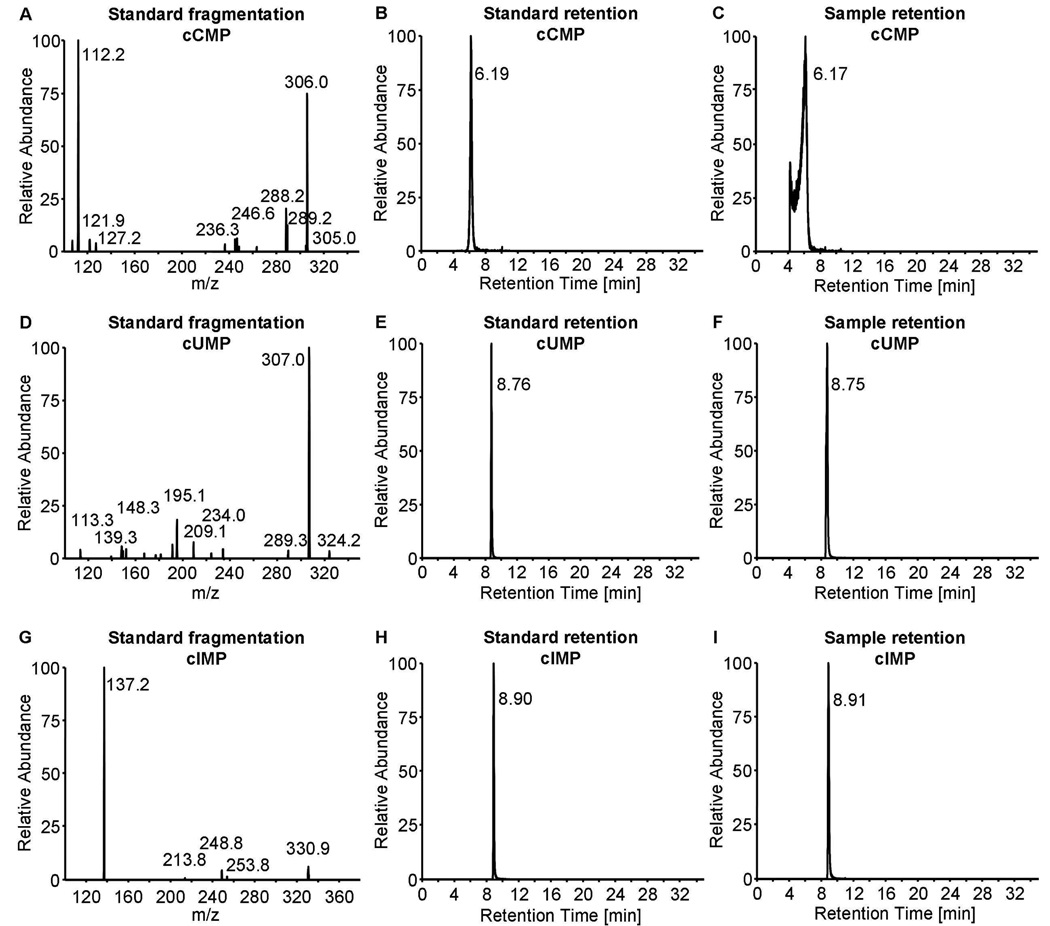
Cyclic adenosine 3',5'-monophosphate (cAMP) and cyclic guanosine 3',5'-monophosphate (cGMP) are second messengers for numerous mammalian cell functions. The natural occurrence and synthesis of a third cyclic nucleotide (cNMP), cyclic cytidine 3',5'-monophosphate (cCMP), is a matter of controversy, and almost nothing is known about cyclic uridine 3',5'-monophosphate (cUMP). Bacillus anthracis and Bordetella pertussis secrete the adenylyl cyclase (AC) toxins edema factor (EF) and CyaA, respectively, weakening immune responses and facilitating bacterial proliferation. A cell-permeable cCMP analogue inhibits human neutrophil superoxide production. Here, we report that EF and CyaA also possess cytidylyl cyclase (CC) and uridylyl cyclase (UC) activity. CC and UC activity was determined by a radiometric assay, using [alpha-(32)P]CTP and [alpha-(32)P]UTP as substrates, respectively, and by a high-performance liquid chromatography method. The identity of cNMPs was confirmed by mass spectrometry. On the basis of available crystal structures, we developed a model illustrating conversion of CTP to cCMP by bacterial toxins. In conclusion, we have shown both EF and CyaA have a rather broad substrate specificity and exhibit cytidylyl and uridylyl cyclase activity. Both cCMP and cUMP may contribute to toxin actions.
Figures

Similar articles
-
cNMP-AMs mimic and dissect bacterial nucleotidyl cyclase toxin effects.Biochem Biophys Res Commun. 2014 Sep 5;451(4):497-502. doi: 10.1016/j.bbrc.2014.07.134. Epub 2014 Aug 7. Biochem Biophys Res Commun. 2014. PMID: 25108158
-
cAMP, cGMP, cCMP and cUMP concentrations across the tree of life: High cCMP and cUMP levels in astrocytes.Neurosci Lett. 2014 Sep 5;579:183-7. doi: 10.1016/j.neulet.2014.07.019. Epub 2014 Jul 23. Neurosci Lett. 2014. PMID: 25062586
-
ExoY from Pseudomonas aeruginosa is a nucleotidyl cyclase with preference for cGMP and cUMP formation.Biochem Biophys Res Commun. 2014 Jul 18;450(1):870-4. doi: 10.1016/j.bbrc.2014.06.088. Epub 2014 Jun 24. Biochem Biophys Res Commun. 2014. PMID: 24971548 Free PMC article.
-
Bacillus anthracis edema factor substrate specificity: evidence for new modes of action.Toxins (Basel). 2012 Jul;4(7):505-35. doi: 10.3390/toxins4070505. Epub 2012 Jul 6. Toxins (Basel). 2012. PMID: 22852066 Free PMC article. Review.
-
cCMP and cUMP Across the Tree of Life: From cCMP and cUMP Generators to cCMP- and cUMP-Regulated Cell Functions.Handb Exp Pharmacol. 2017;238:3-23. doi: 10.1007/164_2016_5005. Handb Exp Pharmacol. 2017. PMID: 28181008 Review.
Cited by
-
Cross Kingdom Activators of Five Classes of Bacterial Effectors.PLoS Pathog. 2015 Jul 23;11(7):e1004944. doi: 10.1371/journal.ppat.1004944. eCollection 2015 Jul. PLoS Pathog. 2015. PMID: 26203905 Free PMC article. Review. No abstract available.
-
A Robust and Sensitive Spectrophotometric Assay for the Enzymatic Activity of Bacterial Adenylate Cyclase Toxins.Toxins (Basel). 2022 Oct 8;14(10):691. doi: 10.3390/toxins14100691. Toxins (Basel). 2022. PMID: 36287960 Free PMC article.
-
cUMP hydrolysis by PDE3A.Naunyn Schmiedebergs Arch Pharmacol. 2017 Mar;390(3):269-280. doi: 10.1007/s00210-016-1328-1. Epub 2016 Dec 14. Naunyn Schmiedebergs Arch Pharmacol. 2017. PMID: 27975297
-
Bacterial Nucleotidyl Cyclases Activated by Calmodulin or Actin in Host Cells: Enzyme Specificities and Cytotoxicity Mechanisms Identified to Date.Int J Mol Sci. 2022 Jun 16;23(12):6743. doi: 10.3390/ijms23126743. Int J Mol Sci. 2022. PMID: 35743184 Free PMC article. Review.
-
Structural and functional characterization of cyclic pyrimidine-regulated anti-phage system.Nat Commun. 2024 Jul 4;15(1):5634. doi: 10.1038/s41467-024-49861-2. Nat Commun. 2024. PMID: 38965224 Free PMC article.
References
-
- Bloch A, Dutschman G, Maue R. Cytidine 3′,5′-monophosphate (cyclic CMP). II. Initiation of leukemia L-1210 cell growth in vitro. Biochem. Biophys. Res. Commun. 1974;59:955–959. - PubMed
-
- Cech SY, Ignarro LJ. Cytidine 3′,5′-monophosphate (cyclic CMP) formation by homogenates of mouse liver. Biochem. Biophys. Res. Commun. 1978;80:119–125. - PubMed
-
- Gaion RM, Krishna G. Cytidylate cyclase: The product isolated by the method of Cech and Ignarro is not cytidine 3′,5′-monophosphate. Biochem. Biophys. Res. Commun. 1979;86:105–111. - PubMed
Publication types
MeSH terms
Substances
Grants and funding
LinkOut - more resources
Full Text Sources
Molecular Biology Databases
