Multicenter Study
. 2010 Nov;21(11):1251-9.
doi: 10.1111/j.1540-8167.2010.01809.x.

Accurate ECG diagnosis of atrial tachyarrhythmias using quantitative analysis: a prospective diagnostic and cost-effectiveness study

Affiliations
Multicenter Study

Accurate ECG diagnosis of atrial tachyarrhythmias using quantitative analysis: a prospective diagnostic and cost-effectiveness study

David E Krummen et al. J Cardiovasc Electrophysiol. 2010 Nov.

Abstract

Quantitative ECG Analysis.

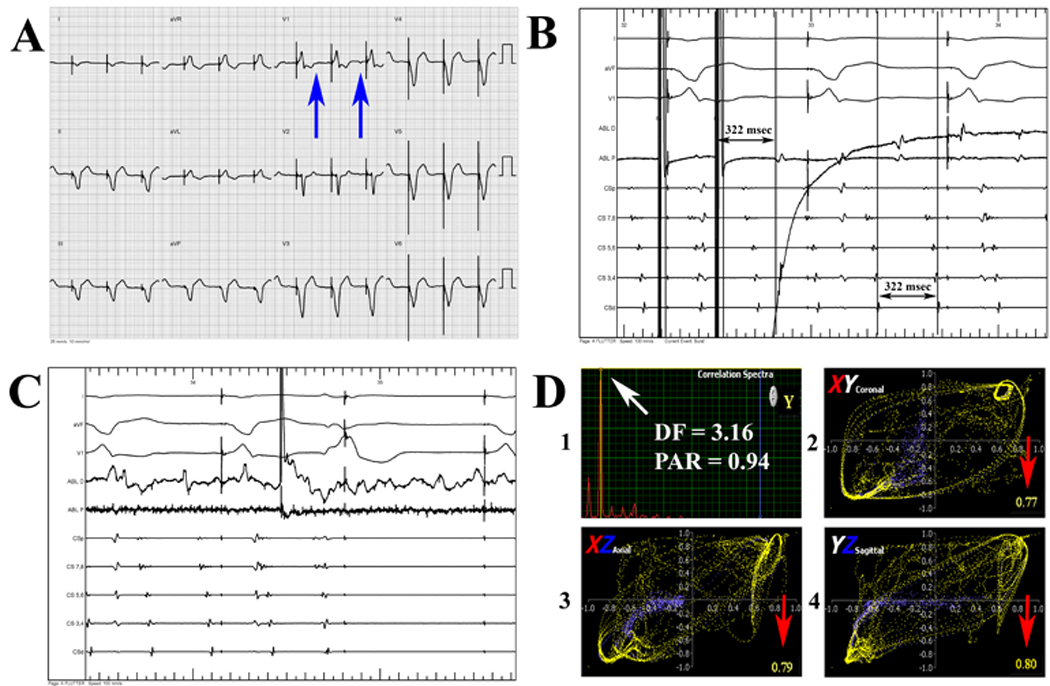
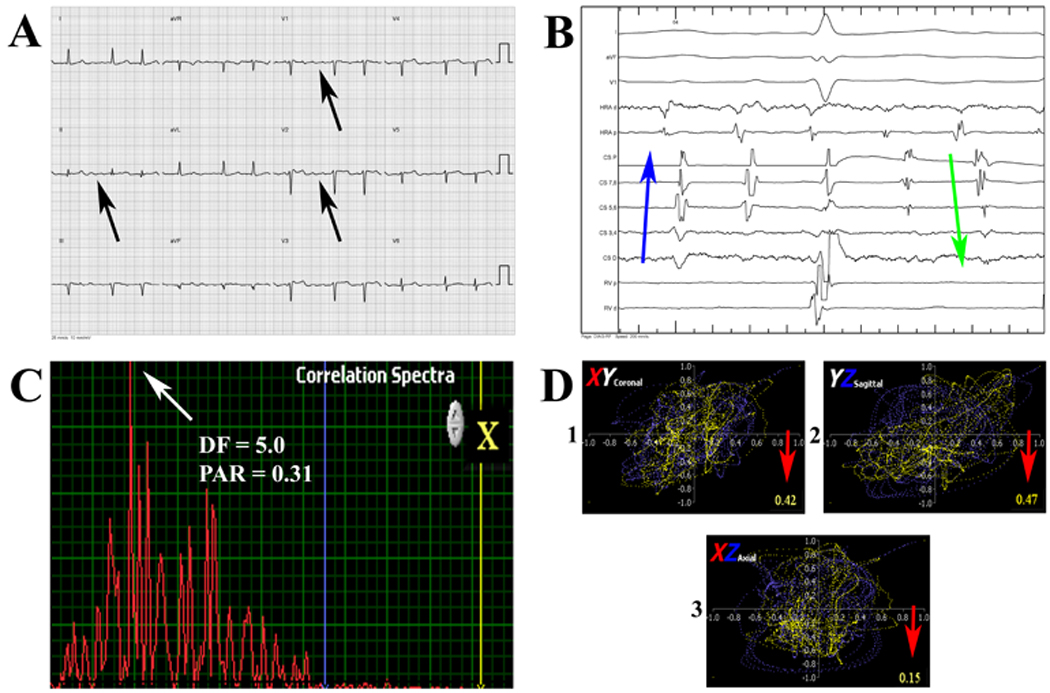
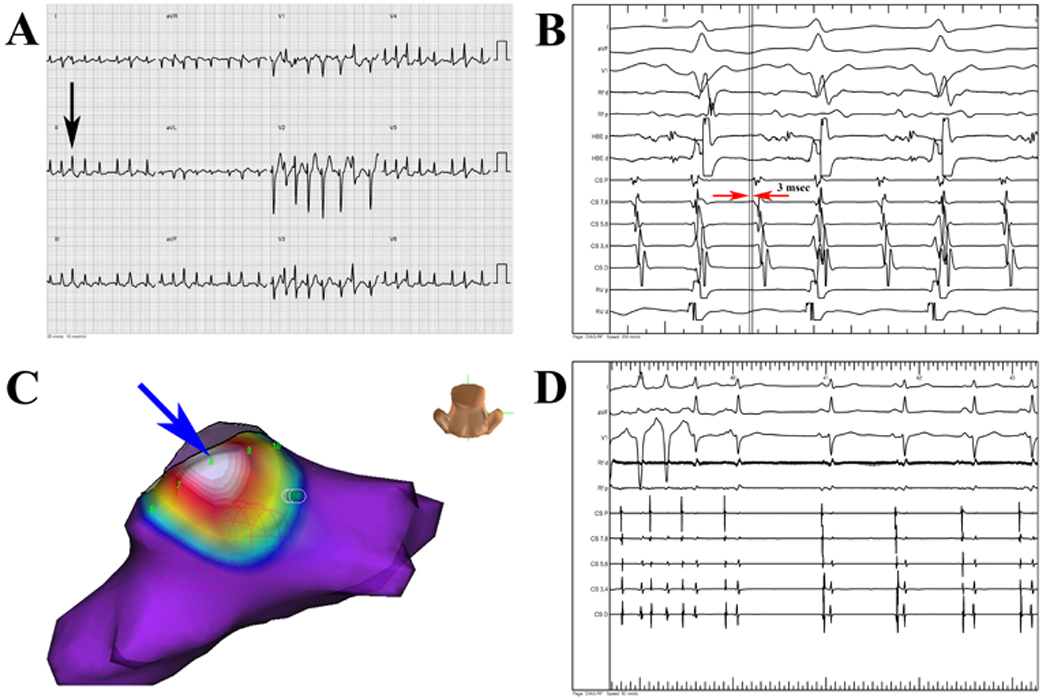
Introduction: Optimal atrial tachyarrhythmia management is facilitated by accurate electrocardiogram interpretation, yet typical atrial flutter (AFl) may present without sawtooth F-waves or RR regularity, and atrial fibrillation (AF) may be difficult to separate from atypical AFl or rapid focal atrial tachycardia (AT). We analyzed whether improved diagnostic accuracy using a validated analysis tool significantly impacts costs and patient care.

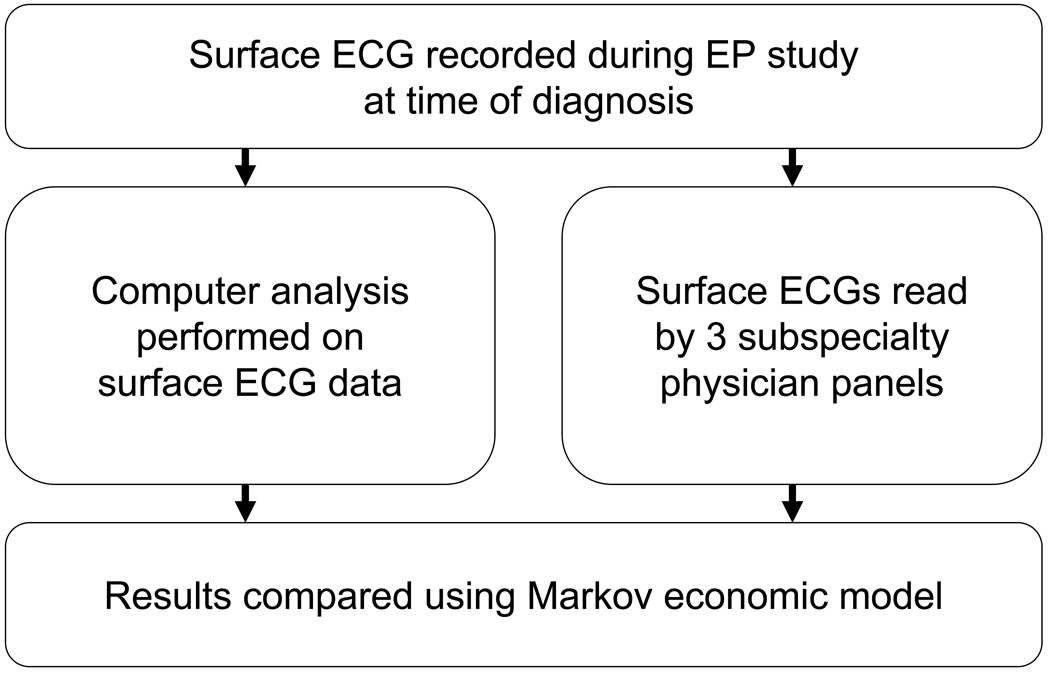
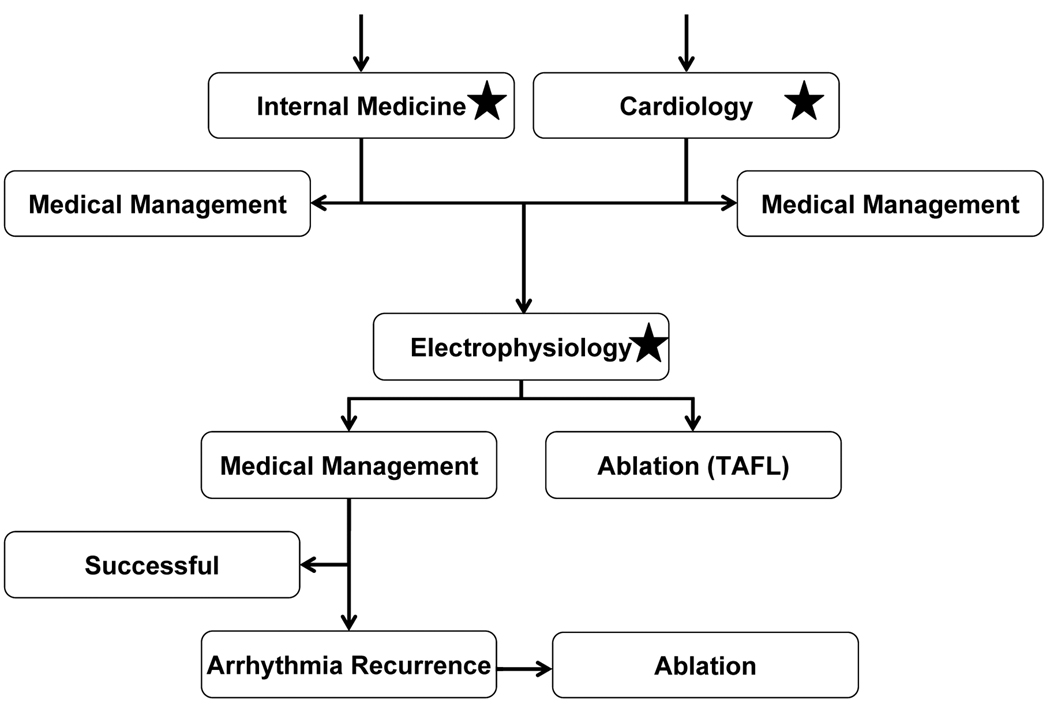
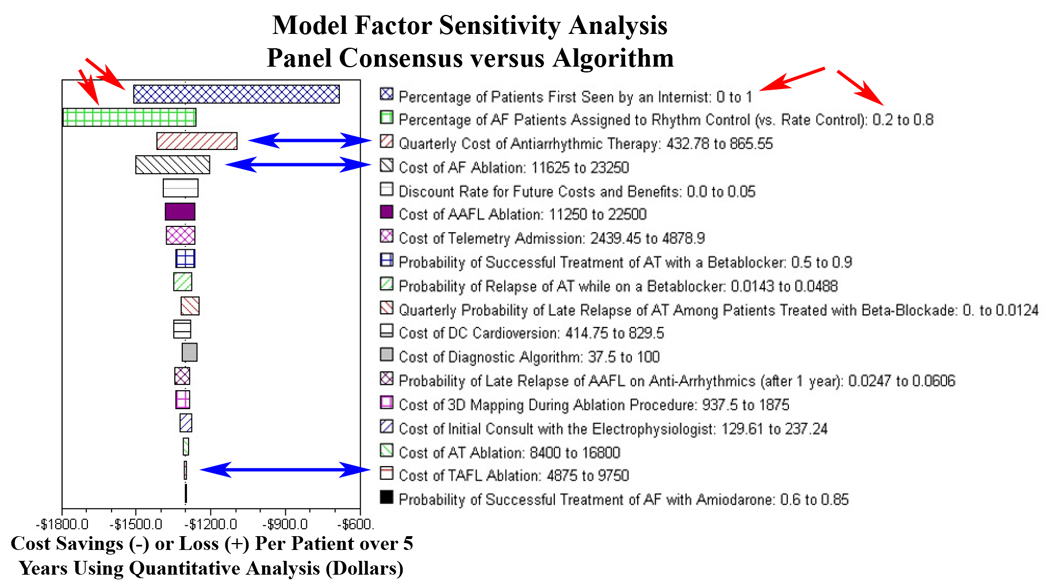
Methods and results: We performed a prospective, blinded, multicenter study using a novel quantitative computerized algorithm to identify atrial tachyarrhythmia mechanism from the surface ECG in patients referred for electrophysiology study (EPS). In 122 consecutive patients (age 60 ± 12 years) referred for EPS, 91 sustained atrial tachyarrhythmias were studied. ECGs were also interpreted by 9 physicians from 3 specialties for comparison and to allow healthcare system modeling. Diagnostic accuracy was compared to the diagnosis at EPS. A Markov model was used to estimate the impact of improved arrhythmia diagnosis. We found 13% of typical AFl ECGs had neither sawtooth flutter waves nor RR regularity, and were misdiagnosed by the majority of clinicians (0/6 correctly diagnosed by consensus visual interpretation) but correctly by quantitative analysis in 83% (5/6, P = 0.03). AF diagnosis was also improved through use of the algorithm (92%) versus visual interpretation (primary care: 76%, P < 0.01). Economically, we found that these improvements in diagnostic accuracy resulted in an average cost-savings of $1,303 and 0.007 quality-adjusted-life-years per patient.

Conclusions: Typical AFl and AF are frequently misdiagnosed using visual criteria. Quantitative analysis improves diagnostic accuracy and results in improved healthcare costs and patient outcomes.


Figures

Figure 1
Figure 1
Study design. Surface ECG data was recorded at the time of diagnosis during electrophysiology study (top) and separately evaluated using a computer algorithm (middle left) versus subspecialty clinician panels (middle right). Diagnostic accuracy of computer versus visual interpretation was then compared using a Markov economic model (bottom).
Figure 2
Figure 2
Outline of Markov model. In this simulation of 1000 patients, economic and patient outcomes were compared between management using quantitative ECG analysis and without. Patients entered this hypothetical healthcare system at in the primary care (internal medicine) and cardiology clinics. Asymptomatic patients diagnosed with atrial fibrillation (AF) were assigned to medical management, while symptomatic patients and those with other tachyarrhythmia diagnoses are referred to electrophysiology (EP). Evaluation in the EP clinic was simulated, and patients diagnosed with typical atrial flutter (TAFL) are referred to ablation, while the remainder was treated with antiarrhythmics. Using published data, a proportion of patients on antiarrhythmic therapy have arrhythmia recurrence, and those patients are referred to ablation. In this simulated system, we incorporated either the specialty panels’ diagnostic accuracy or the computer analysis (locations in model noted by stars), and compared quality of life and cost of care.
Figure 3
Figure 3
Example surface ECG (A) during tachycardia obtained at electrophysiology study from a patient with coronary artery disease, hypertension, ventricular tachycardia (VT) s/p dual chamber implantable cardioverter-defibrillator (ICD) implantation, and VT ablation for recurrent ICD shocks that had a highly symptomatic supraventricular tachycardia. All clinicians incorrectly diagnosed the surface ECG as atrial fibrillation (AF) or atypical atrial flutter (AFl), based on ICD interrogation showing regular atrial activation). The atypical F-wave appearance on surface ECG (blue arrows) is shown. During electrophysiology study (B), patient was diagnosed with typical AFl with a cycle length of 322 msec by concealed entrainment within the cavo-tricuspid isthmus (CTI) and termination of tachyarrhythmia without reinducibility during ablation within the CTI (C). Correct diagnosis as typical AFl (D) was made independently using quantitative analysis (narrow correlation function spectra [peak area ratio (PAR) = 0.94, D1] reducing probability of AF, and high temporospatial correlation in the XY, YZ, and XZ planes [D1, D2, and D3, correlation values ≥ 0.75 at red arrows] reducing probability of atypical atrial flutter) with a relatively long atrial activation > 45% of tachycardia cycle length [322 msec] reducing probability of atrial tachycardia). The use of quantitative analysis would have saved used of NavX patches (~$1000), and prevented scheduling case in a long EP lab time block. Abbreviation: DF = dominant frequency
Figure 4
Figure 4
Surface ECG (A) of a 64 year old patient with a history of congestive heart failure, ventricular tachycardia s/p ablation and dual chamber ICD who presented with a symptomatic supraventricular tachycardia. Patient was diagnosed with atypical atrial flutter due to ICD interrogation showed a relatively regular atrial tachycardia cycle length and what appeared to be flutter waves on surface ECG (black arrows). Electrophysiology study showed frequent alternation between concentric and eccentric coronary sinus activation (B), consistent with atrial fibrillation (blue and green arrows). Quantitative analysis showed a broad correlation spectra (peak area ratio (PAR) = 0.31, C), and low temporospatial correlation (red arrows, D), consistent with AF. Abbreviation: DF = dominant frequency
Figure 5
Figure 5
Surface ECG (A) of a patient diagnosed with atrial fibrillation (AF) by all clinicians due to rapid, irregular ventricular activation and lack of regular F-waves (black arrow). Patient was found to have focal atrial tachycardia (AT) at EPS due to regular CS activation (B) with CS 7–8 earlier than CS 9–10 by 3 msec (red arrows). Rapid, focal activation (C) from inferior posterior left atrium (blue arrow) by using noncontact activation mapping (EnSite Array). Ablation at focal source terminated tachycardia (D), which was subsequently non-inducible. Independent quantitative analysis correctly diagnosed arrhythmia as focal AT, potentially helping plan use of noncontact mapping.
Figure 6
Figure 6
Factor sensitivity analysis for the Markov model reflecting impact of input parameter variation on cost-of-care. Parameter uncertainty in the model was evaluated using a large number of one- and two-way sensitivity analyses, and the results were noted to be robust across the entire range of all tested parameters. This was done separately for cost and QALYs, and for the incremental cost-effectiveness ratio. Important parameters are displayed in descending order of impact on the model for the variations shown. Relatively greater cost differential between primary care diagnosis and algorithm reflected in top 2 parameters (red arrows), highlighting greater diagnostic accuracy using quantitative analysis for all arrhythmias. Relatively lower cost differential in use of algorithm versus without in electrophysiology setting (blue arrows) reflects significant performance improvement in diagnosis of typical atrial flutter only. Note using the algorithm costs less than the not using the algorithm for all variations in input parameters, reflected by negative values for all sensitivity analyses. Abbreviations: QALYs = Quality-Adjusted Life Years, TAFL = typical atrial flutter, AAFL = atypical atrial flutter, AT = focal atrial tachycardia, and AF = atrial fibrillation.

Similar articles

Cited by

References

    1. Blomstrom-Lundqvist C, Scheinman MM, Aliot EM, Alpert JS, Calkins H, Camm AJ, Campbell WB, Haines DE, Kuck KH, Lerman BB, Miller DD, Shaeffer CW, Stevenson WG, Tomaselli GF, Antman EM, Smith SC, Jr, Alpert JS, Faxon DP, Fuster V, Gibbons RJ, Gregoratos G, Hiratzka LF, Hunt SA, Jacobs AK, Russell RO, Jr, Priori SG, Blanc JJ, Budaj A, Burgos EF, Cowie M, Deckers JW, Garcia MA, Klein WW, Lekakis J, Lindahl B, Mazzotta G, Morais JC, Oto A, Smiseth O, Trappe HJ. ACC/AHA/ESC guidelines for the management of patients with supraventricular arrhythmias--executive summary. a report of the American college of cardiology/American heart association task force on practice guidelines and the European society of cardiology committee for practice guidelines (writing committee to develop guidelines for the management of patients with supraventricular arrhythmias) developed in collaboration with NASPE-Heart Rhythm Society. J Am Coll Cardiol. 2003;42:1493–1531. - PubMed
    1. Chugh SS, Blackshear JL, Shen WK, Hammill SC, Gersh BJ. Epidemiology and natural history of atrial fibrillation: clinical implications. J Am Coll Cardiol. 2001;37:371–378. - PubMed
    1. Reynolds MR, Essebag V, Zimetbaum P, Cohen DJ. Healthcare resource utilization and costs associated with recurrent episodes of atrial fibrillation: the FRACTAL registry. J Cardiovasc Electrophysiol. 2007;18:628–633. - PMC - PubMed
    1. Bochoeyer A, Yang Y, Cheng J, Lee RJ, Keung EC, Marrouche NF, Natale A, Scheinman MM. Surface electrocardiographic characteristics of right and left atrial flutter. Circulation. 2003;108:60–66. - PubMed
    1. Krummen DE, Feld GK, Narayan SM. Diagnostic Accuracy of Irregularly Irregular RR Intervals in Separating Atrial Fibrillation from Atrial Flutter. Am J Cardiol. 2006;98:209–214. - PubMed

Publication types

MeSH terms