. 2010 May 28;4 Suppl 1(Suppl 1):S2.
doi: 10.1186/1752-0509-4-S1-S2.

Prioritization of disease microRNAs through a human phenome-microRNAome network

Affiliations

Prioritization of disease microRNAs through a human phenome-microRNAome network

Qinghua Jiang et al. BMC Syst Biol. .

Abstract

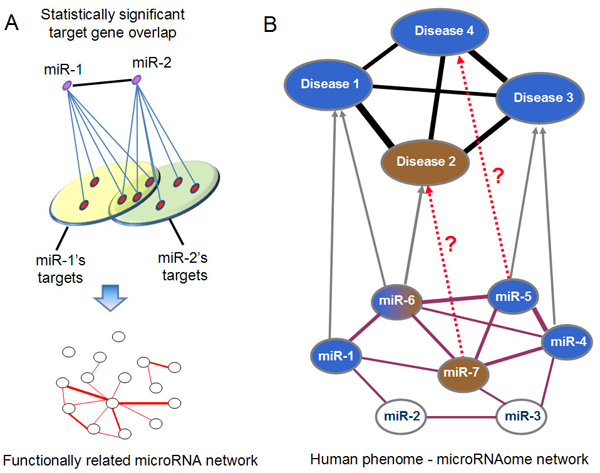
Background: The identification of disease-related microRNAs is vital for understanding the pathogenesis of diseases at the molecular level, and is critical for designing specific molecular tools for diagnosis, treatment and prevention. Experimental identification of disease-related microRNAs poses considerable difficulties. Computational analysis of microRNA-disease associations is an important complementary means for prioritizing microRNAs for further experimental examination.

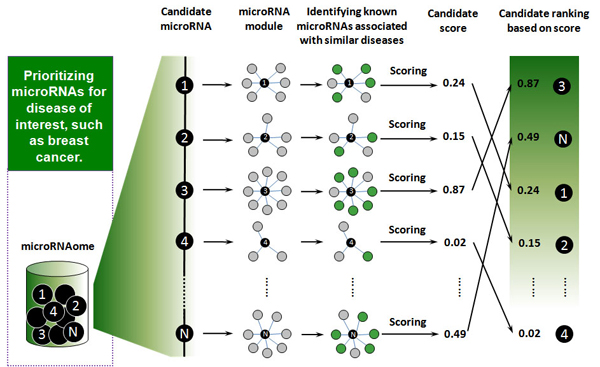
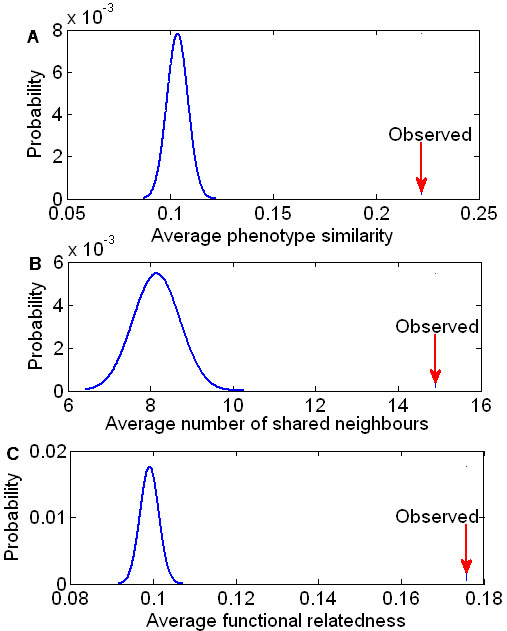
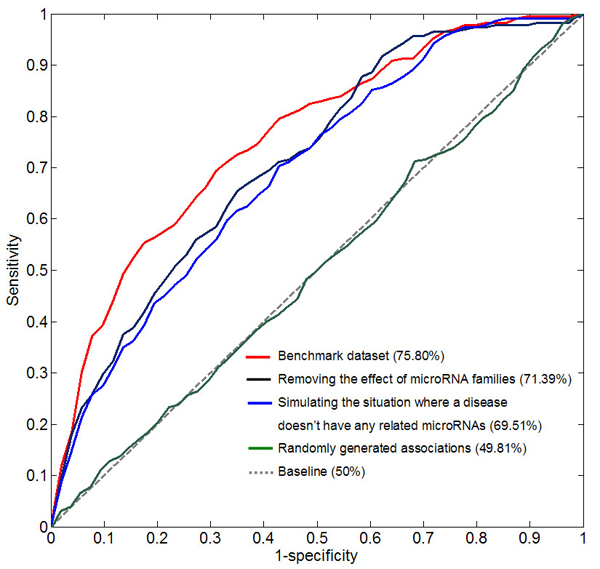
Results: Herein, we devised a computational model to infer potential microRNA-disease associations by prioritizing the entire human microRNAome for diseases of interest. We tested the model on 270 known experimentally verified microRNA-disease associations and achieved an area under the ROC curve of 75.80%. Moreover, we demonstrated that the model is applicable to diseases with which no known microRNAs are associated. The microRNAome-wide prioritization of microRNAs for 1,599 disease phenotypes is publicly released to facilitate future identification of disease-related microRNAs.

Conclusions: We presented a network-based approach that can infer potential microRNA-disease associations and drive testable hypotheses for the experimental efforts to identify the roles of microRNAs in human diseases.


Figures

Figure 1
Figure 1
Construction and application of a human phenome-microRNAome network. (A) Construction of a functionally related microRNA network. An edge is placed between two microRNAs if they share significant number of target genes. (B) Application of the phenome-microRNAome network to infer new microRNA-disease associations. A gray edge connects known disease-related microRNA to the corresponding disease. Disease 2 has a related microRNA (miR-6), and disease 4 doesn’t have any related microRNAs. The red dash lines represent the potential microRNA-disease associations that might be predicted by this network model.
Figure 2
Figure 2
Functionally related microRNAs tend to be associated with Phenotypically similar diseases. (A) The observed average phenotypic similarity score (arrow) of 349 phenotype pairs associated with common microRNAs and the distribution of expected average phenotypic similarity scores (curve) of 10,000 random control sets containing the same number of randomly sampled phenotype pairs (p<10-4). (B, C) The observed average functional relatedness (arrow) of 1,252 microRNA pairs associated with common diseases and the distribution of the expected average functional relatedness (curve) of 10,000 random control sets containing the same number of randomly sampled microRNA pairs (p<10-4). The measures for functional relatedness between microRNAs are the average number of shared network neighbors and a function value that is derived from the shortest path length.
Figure 3
Figure 3
Leave-one-out cross-validation results. The red curve was derived from 270 experimentally verified microRNA-disease associations. The blue curve represents the performance of the model to prioritize microRNAs for diseases with which no microRNAs have been experimentally verified to be associated. The green curve was obtained from 270 randomly generated microRNA-disease associations.
Figure 4
Figure 4
Steps in prioritizing the entire microRNAome for a disease of interest. First, a virtual pull-down of each candidate generates a hypothetical microRNA module, defined as a given microRNA (the center of the module) plus its direct network neighbors in the functionally related microRNA network. Second, in each microRNA module, the microRNAs linked to diseases that have similar phenotypes with the disease being investigated are identified. Finally, all candidates are scored and prioritized.

References

    1. Lage K, Karlberg EO, Storling ZM, Olason PI, Pedersen AG, Rigina O, Hinsby AM, Tumer Z, Pociot F, Tommerup N. A human phenome-interactome network of protein complexes implicated in genetic disorders. Nat Biotechnol. 2007;25:309–316. doi: 10.1038/nbt1295. - DOI - PubMed
    1. Kohler S, Bauer S, Horn D, Robinson PN. Walking the interactome for prioritization of candidate disease genes. Am J Hum Genet. 2008;82:949–958. doi: 10.1016/j.ajhg.2008.02.013. - DOI - PMC - PubMed
    1. Ala U, Piro RM, Grassi E, Damasco C, Silengo L, Oti M, Provero P, Di Cunto F. Prediction of human disease genes by human-mouse conserved coexpression analysis. PLoS Comput Biol. 2008;4:e1000043. doi: 10.1371/journal.pcbi.1000043. - DOI - PMC - PubMed
    1. Gaulton KJ, Mohlke KL, Vision TJ. A computational system to select candidate genes for complex human traits. Bioinformatics. 2007;23:1132–1140. doi: 10.1093/bioinformatics/btm001. - DOI - PubMed
    1. George RA, Liu JY, Feng LL, Bryson-Richardson RJ, Fatkin D, Wouters MA. Analysis of protein sequence and interaction data for candidate disease gene prediction. Nucleic Acids Res. 2006;34:e130. doi: 10.1093/nar/gkl707. - DOI - PMC - PubMed

Publication types

LinkOut - more resources