. 2010 May 28;4 Suppl 1(Suppl 1):S5.
doi: 10.1186/1752-0509-4-S1-S5.

A conceptual cellular interaction model of left ventricular remodelling post-MI: dynamic network with exit-entry competition strategy

Affiliations

A conceptual cellular interaction model of left ventricular remodelling post-MI: dynamic network with exit-entry competition strategy

Yunji Wang et al. BMC Syst Biol. .

Abstract

Background: Progressive remodelling of the left ventricle (LV) following myocardial infarction (MI) is an outcome of spatial-temporal cellular interactions among different cell types that leads to heart failure for a significant number of patients. Cellular populations demonstrate temporal profiles of flux post-MI. However, little is known about the relationship between cell populations and the interaction strength among cells post-MI. The objective of this study was to establish a conceptual cellular interaction model based on a recently established graph network to describe the interaction between two types of cells.

Results: We performed stability analysis to investigate the effects of the interaction strengths, the initial status, and the number of links between cells on the cellular population in the dynamic network. Our analysis generated a set of conditions on interaction strength, structure of the network, and initial status of the network to predict the evolutionary profiles of the network. Computer simulations of our conceptual model verified our analysis.

Conclusions: Our study introduces a dynamic network to model cellular interactions between two different cell types which can be used to model the cellular population changes post-MI. The results on stability analysis can be used as a tool to predict the responses of particular cell populations.


Figures

Figure 1
Figure 1
The structure of the dynamic network in the exit-entry updating process During the exit-entry updating process, a vacated vertex is replaced by a new macrophage according to the fitness function determined by its neighbouring cells. An original network is shown in the left part of Figure 1 (Left). If a cell, marked in gray, exits the network, the possibility of replacing this cell with either a type C (classically activated macrophage) or type A (alternatively activated macrophage) cell is determined by the fitness function of the neighbouring cells. Cost function of each cell linked to the vacated cell is shown in the middle of the figure (Middle). In this case, the fitness function of all type C cells is calculated as FA = 4(1 − ω)+ ω(10a + 2b). Similarly, the fitness function determined by the connected type C cells can be calculated as FC = 4(1 − ω)+ ω(3c + 5d). The gray vertex may be replaced by a type A cell with probability formula image
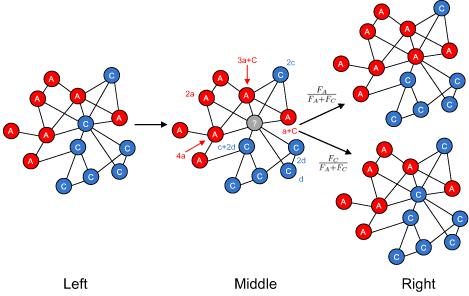
, or a type C cell with probability of formula image according to the exit-entry evolutionary strategy, which is shown in the right part of Figure 1 (Right).
Figure 2
Figure 2
Effects of interaction strengths on the stability of the dynamic network with different interaction matrix (PA → 1) Figure 2 demonstrates the evolutionary dynamics of a network with interaction matrix [1 0; 0 1], k=4, and initial populations of type A and type C cells are set as 9900 and 100 in a total population of 10000 cells, based on previously published experimental results. The intensity of selection ω equals to 0.01. In the left part of Figure 2 (Left), X axis represents the variable PA, the ratio of type A cellular population over the total population. The Y axis represents the evolutionary rate of type A cellular population denoted as A. The red star is the initial status of PA. At the initial status, A is positive, making PA increase until PA reaches 1 where A decreases to 0. In the right part of Figure 2 (Right), the simulation results demonstrate that population of type A cells increases until it dominates the whole population within 300 generations.
Figure 3
Figure 3
Effects of interaction strengths on the stability of the dynamic network with different interaction matrix (PA → 1) Figure 3 demonstrates the evolutionary dynamics with interaction matrix as [0 -0.5; 1 0], k=4, and initial populations of type A and C cells are set as 9900 and 100 in a total population of 10000 cells. The intensity of selection ω equals to 0.01. As shown in the left part of figure (Left), A is negative in the region of PA ∈ (0, 1). It means the population of type A cells decreases in the interval of PA ∈ (0, 1) until all type A cells exit the system, and A = 0. In the right part of the figure (Right), the simulation results demonstrate that population of type A cells decreases until all type A cells exit the system within 600 generations.
Figure 4
Figure 4
Effects of interaction strength on the stability of the dynamic network with different interaction matrix (PA ∈ (0, 1)) Figure 4 shows the evolutionary dynamics with interaction matrix as [0 1; 1 0], k=4, and initial populations of type A and C cells are set as 9900 and 100 in a total population of 10000, respectively. The intensity of selection ω equals to 0.01. Variable A is negative when the initial status of PA stays in the region between the marked root (red square) and 1 in the left part of the figure(Left). When PA goes to the marked root, A reaches 0. Accordingly, the population of type A cells decreases in the interval of [root, 1] until PA goes to the root denoted at 0.5 in the simulation. The simulation results shown in the right part of the figure (Right) demonstrate that the population of type A cells approached 5000 within 1000 generations.
Figure 5
Figure 5
Effects of initial status on the stability of the dynamic network with different interaction matrix (PA ∈ (0, 1)) Figure 5 shows the evolutionary dynamics with interaction matrix as [0 1; 1 0], k=4, and initial populations of A and B are as 4000 and 6000 in a total population of 10000 cells. The intensity of selection equals to 0.01. A is positive when the initial status of PA stays between 0 and the marked root (red square) in the left part of figure (Left). Accordingly, the population of type A cells increases from the initial status in the interval of [0, root] until PA goes to the root denoted at 0.5 in this simulation. The simulation results shown in the right part of Figure 5 (Right) demonstrate that the population of type A cells approaches 5000 within 800 generations.
Figure 6
Figure 6
Effects of initial status on the stability of the dynamic network Figure 6 shows the evolutionary dynamics with interaction matrix as [0 -1; -2 0], k=4, and initial populations of A and B are set as 9900 and100, respectively, in a total population of 10000. The intensity of selection ω equals to 0.01. As shown in the left part of Figure 6, in the case that initial status of PA stays between the root and 1, A is positive. Therefore, PA increases from the initial status until it goes to 1 and A goes to 0. Simulation results demonstrate that population of type A cells reach 10000 within 300 generations as shown the right part of Figure 6 (Right).
Figure 7
Figure 7
Effects of initial status on the stability of the dynamic network Figure 7 shows the evolutionary dynamics with interaction matrix as [0 -1; -2 0], k=4, and initial populations of A and B are set as 2000 and 8000, respectively, in a total population of 10000. The intensity of selection ω equals to 0.01. As shown in the left part of Figure 7, in the case that initial status of PA stays between 0 and the root (red square), A is negative. Thus, PA decreases from the initial status until it goes to 0 and A goes to 0. Simulation results demonstrate the type A cells totally exit the system within 400 generations as shown the right part of Figure 7 (Right).
Figure 8
Figure 8
Effects of number of links on the stability of the dynamic network Figure 8 shows evolutionary profiles of two dynamic networks with exit-entry interaction matrix [0 b; 1 0] (Left) and [1 0; 0 d] (Right) were simulated with different number of links (k=4, Green stars, k=5 Yellow square, and k=6 Red circles. Population of initial type C cells was set as 100 with a total population of 10,000 cells in the system. The intensity of selection ω was set as 0.01. The markers are the average populations of type C cells after five generations over 104 runs. In the left part of the figure (Left), the horizontal coordinate represents the changes of b value and the vertical coordinate represents the population of type C cells. In the right figure, the horizontal coordinate represents the changes of d value and the vertical coordinate represents the population of type C cells.

Similar articles

Cited by

References

    1. Cohn JN, Ferrari R, Sharpe N. Cardiac remodeling--concepts and clinical implications: a consensus paper from an international forum on cardiac remodeling. Behalf of an International Forum on Cardiac Remodeling. J Am Coll Cardiol. 2000;35(3):569–582. doi: 10.1016/S0735-1097(99)00630-0. - DOI - PubMed
    1. Pfeffer MA, Braunwald E. Ventricular Remodeling After Myocardial Infarction. Experimental observations and clinical implications. Circulation. 1990;81:1161–1172. - PubMed
    1. Lindsey M, Escobar GP, Dobrucki WL, Goshorn KD, Bouges S, Mingoia TJ, McClister MD, Su, Jr. H, Gannon J, MacGillivray C, Lee TR, Sinusas JA. Matrix metalloproteinase-9 gene deletion facilitates angiogenesis after myocardial infarction. Am J Physiol Heart Circ Physiol 2006. 2006;290():H232–H239. doi: 10.1016/S0735-1097(99)00630-0. - DOI - PubMed
    1. Lindsey ML. MMP induction and inhibition in myocardial infarction. Heart Fail Rev. 2004;9(1):7–19. doi: 10.1023/B:HREV.0000011390.44039.b7. - DOI - PubMed
    1. Yang F, Liu YH, Yang XP, Xu J, Kapke A, Carretero OA. Myocardial infarction and cardiac remodelling in mice. Exp Physiol. 2002;87(5):547–555. doi: 10.1113/eph8702385. - DOI - PubMed

Publication types