. 2010 Oct;59(10):2453-64.
doi: 10.2337/db09-1293. Epub 2010 Jun 3.

Inhibition of de novo ceramide synthesis reverses diet-induced insulin resistance and enhances whole-body oxygen consumption

Affiliations

Inhibition of de novo ceramide synthesis reverses diet-induced insulin resistance and enhances whole-body oxygen consumption

John R Ussher et al. Diabetes. 2010 Oct.

Abstract

Objective: It has been proposed that skeletal muscle insulin resistance arises from the accumulation of intramyocellular lipid metabolites that impede insulin signaling, including diacylglycerol and ceramide. We determined the role of de novo ceramide synthesis in mediating muscle insulin resistance.

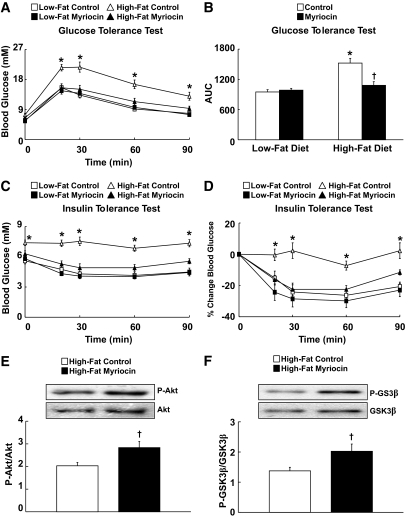
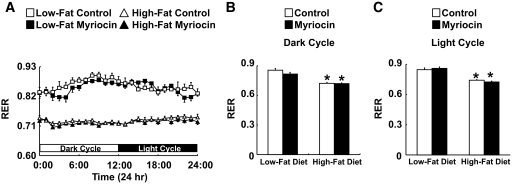
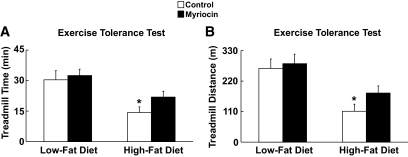
Research design and methods: Mice were subjected to 12 weeks of diet-induced obesity (DIO), and then treated for 4 weeks with myriocin, an inhibitor of serine palmitoyl transferase-1 (SPT1), the rate-limiting enzyme of de novo ceramide synthesis.

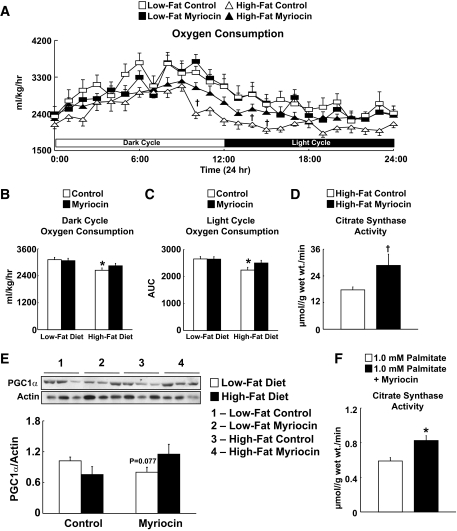
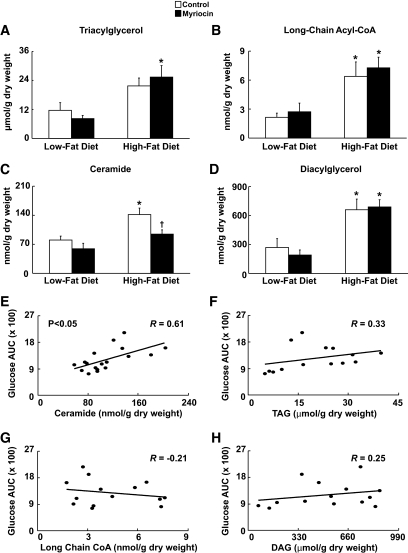
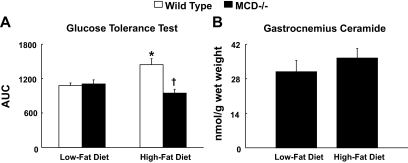
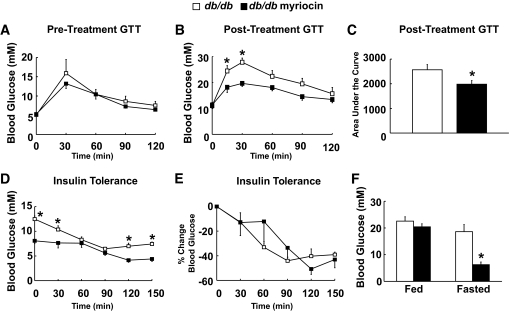
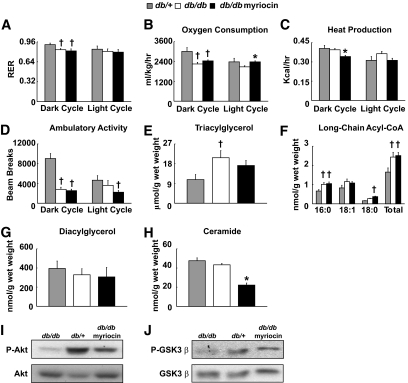
Results: After 12 weeks of DIO, C57BL/6 mice demonstrated a doubling in gastrocnemius ceramide content, which was completely reversed (141.5 ± 15.8 vs. 94.6 ± 10.2 nmol/g dry wt) via treatment with myriocin, whereas hepatic ceramide content was unaffected by DIO. Interestingly, myriocin treatment did not alter the DIO-associated increase in gastrocnemius diacyglycerol content, and the only correlation observed between lipid metabolite accumulation and glucose intolerance occurred with ceramide (R = 0.61). DIO mice treated with myriocin showed a complete reversal of glucose intolerance and insulin resistance which was associated with enhanced insulin-stimulated Akt and glycogen synthase kinase 3β phosphorylation. Furthermore, myriocin treatment also decreased intramyocellular ceramide content and prevented insulin resistance development in db/db mice. Finally, myriocin-treated DIO mice displayed enhanced oxygen consumption rates (3,041 ± 124 vs. 2,407 ± 124 ml/kg/h) versus their control counterparts.

Conclusions: Our results demonstrate that the intramyocellular accumulation of ceramide correlates strongly with the development of insulin resistance, and suggests that inhibition of SPT1 is a potentially promising target for the treatment of insulin resistance.


Figures

FIG. 1.
FIG. 1.
Inhibition of serine palmitoyl transferase 1 (SPT1) reverses high-fat diet–induced insulin resistance and improves insulin signaling. A: Glucose tolerance test in low-fat–fed and obese insulin-resistant mice treated with either vehicle control or myriocin. B: Area under the curve during the glucose tolerance test. C: Insulin tolerance test in low-fat diet and obese insulin-resistant mice treated with either vehicle control or myriocin. D: Percent change in blood glucose levels during the insulin tolerance test. E: Insulin-stimulated Akt phosphorylation at serine 473, and (F) GSK3β phosphorylation at serine 9 in gastrocnemius muscle of obese insulin-resistant mice treated with either vehicle control or myriocin. Values represent mean ± SE (n = 8–12 for A–D; n = 4 for E and F). Differences were determined using either a two-tailed Student t test or a two-way ANOVA followed by a Bonferroni post hoc analysis. *P < 0.05, significantly different from all other groups. †P < 0.05, significantly different from the high-fat diet control mice.
FIG. 2.
FIG. 2.
Substrate preference in lean and obese mice. Twenty-four-hour (A), dark cycle (B), and light cycle respiratory exchange ratio (C) in low-fat–fed and obese insulin-resistant mice treated with either vehicle control or myriocin. Values represent mean ± SE (n = 8–12). Differences were determined using a two-way ANOVA followed by a Bonferroni post hoc analysis. *P < 0.05, significantly different from the low-fat diet counterpart.
FIG. 3.
FIG. 3.
Myriocin treatment reverses the impairment in aerobic exercise capacity caused by DIO. Time (A) and distance (B) during an exercise capacity challenge on a running treadmill. Values represent mean ± SE (n = 8–12). Differences were determined using a two-way ANOVA followed by a Bonferroni post hoc analysis. *P < 0.05, significantly different from the low-fat diet counterpart.
FIG. 4.
FIG. 4.
Myriocin treatment reverses the impairment in whole-body oxygen consumption rates caused by DIO. A–C: Twenty-four hour (A), dark cycle (B), and light cycle (C) whole-body oxygen consumption assessment in low-fat diet and obese insulin-resistant mice treated with either vehicle control or myriocin. D: Gastrocnemius muscle citrate synthase activity in vehicle control and myriocin-treated DIO mice. E: PGC1α expression in low-fat diet and obese insulin-resistant mice treated with either vehicle control or myriocin. F: Citrate synthase activity in vehicle control and myriocin-pretreated C2C12 skeletal muscle myotubes exposed to 1.0 mmol/l palmitate for 16 h. Values represent mean ± SE (n = 5–12). Differences were determined using either a two-tailed Student t test or a two-way ANOVA followed by a Bonferroni post hoc analysis. *P < 0.05, significantly different from the low-fat diet counterpart. †P < 0.05, significantly different from the high-fat diet control mice. AUC, area under the curve.
FIG. 5.
FIG. 5.
Inhibition of SPT1 reduces skeletal muscle ceramide levels with no effect on other lipid metabolites. A–D: Gastrocnemius triacylglycerol (TAG) (A), long-chain acyl-CoA (B), ceramide (C), and diacylglycerol (D) levels in low-fat–fed and obese insulin-resistant mice treated with either vehicle control or myriocin. Values represent mean ± SE (n = 4–8). Differences were determined using a two-way ANOVA followed by Bonferroni post hoc analysis. *P < 0.05, significantly different from the low-fat diet counterpart. †P < 0.05, significantly different from the high-fat diet control mice. E–H: Correlation between the respective areas under the curve during the glucose tolerance test and ceramide (E), TAG (F), long-chain acyl-CoA (G), and diacylglycerol (H) content of (n = 14–18) samples. Correlation was determined via Pearson correlation test. R, multivariate correlation coefficient. AUC, area under the curve.
FIG. 6.
FIG. 6.
Malonyl CoA decarboxylase-deficient mice (MCD−/−) do not accumulate skeletal muscle ceramide after 12 weeks of high-fat feeding. A: Area under the curve during a glucose tolerance test after 12 weeks of high-fat feeding in wild-type and MCD−/− mice. B: Corresponding gastrocnemius ceramide levels in MCD−/− mice after 12 weeks of high-fat feeding. Values represent mean ± SE (n = 5–8). Differences were determined using a two-way ANOVA followed by Bonferroni post hoc analysis. *P < 0.05, significantly different from low-fat diet counterpart. †P < 0.05, significantly different from the high-fat diet wild-type mice. AUC, area under the curve.
FIG. 7.
FIG. 7.
Prevention of insulin resistance in db/db mice via myriocin treatment. A: Pretreatment glucose tolerance test (GTT) in db/db mice at 6 weeks of age. B: GTT in db/db mice treated with vehicle control or myriocin. C: Respective areas under the curve for the post-treatment GTT in db/db mice. D: Insulin tolerance test (ITT) in db/db mice treated with vehicle control or myriocin. E: Percent change in blood glucose levels during the ITT. F: Fed and fasted plasma glucose levels in db/db mice treated with vehicle control or myriocin. Values represent mean ± SE (n = 5–6). Differences were determined using either a two-tailed Student t test, or a one-way or two-way ANOVA followed by Bonferroni post hoc analysis. *P < 0.05, significantly different from the db/db control mice.
FIG. 8.
FIG. 8.
In vivo metabolic parameters, intramyocellular lipid metabolite profile, and insulin signaling in db/db mice treated with myriocin. RER (A), whole-body oxygen consumption (B), heat production (C), and ambulatory activity (D) in db/+ heterozygous mice, and db/db mice treated with vehicle control or myriocin. Gastrocnemius triacylglycerol (E), long-chain acyl-CoA (F), diacylglycerol (G), and ceramide levels (H) in db/+ heterozygous mice, and db/db mice treated with vehicle control or myriocin. I: Insulin stimulated Akt phosphorylation at serine 473, and (J) GSK3β phosphorylation at serine 9 in gastrocnemius muscle of db/+ heterozygous mice and db/db mice treated with vehicle control or myriocin. Values represent mean ± SE (n = 3–5). Differences were determined using either a one-way or two-way ANOVA followed by Bonferroni post hoc analysis. *P < 0.05, significantly different from the db/db control mice. †P < 0.05, significantly different from the db/+ heterozygous mice.

Comment in

References

    1. Kahn SE, Hull RL, Utzschneider KM. Mechanisms linking obesity to insulin resistance and type 2 diabetes. Nature 2006;444:840–846 - PubMed
    1. Muoio DM, Newgard CB. Obesity-Related Derangements in Metabolic Regulation. Annu Rev Biochem, 2006 - PubMed
    1. Savage DB, Petersen KF, Shulman GI. Disordered lipid metabolism and the pathogenesis of insulin resistance. Physiol Rev 2007;87:507–520 - PMC - PubMed
    1. Shulman GI. Cellular mechanisms of insulin resistance. J Clin Invest 2000;106:171–176 - PMC - PubMed
    1. Choi CS, Savage DB, Abu-Elheiga L, Liu ZX, Kim S, Kulkarni A, Distefano A, Hwang YJ, Reznick RM, Codella R, Zhang D, Cline GW, Wakil SJ, Shulman GI. Continuous fat oxidation in acetyl-CoA carboxylase 2 knockout mice increases total energy expenditure, reduces fat mass, and improves insulin sensitivity. Proc Natl Acad Sci U S A 2007;104:16480–16485 - PMC - PubMed

Publication types

MeSH terms