. 2010 Jul;177(1):362-76.
doi: 10.2353/ajpath.2010.090870. Epub 2010 Jun 3.

Tracheal Basal cells: a facultative progenitor cell pool

Affiliations

Tracheal Basal cells: a facultative progenitor cell pool

Brook B Cole et al. Am J Pathol. 2010 Jul.

Erratum in

  • Am J Pathol. 2010 Oct;177(4):2145

Abstract

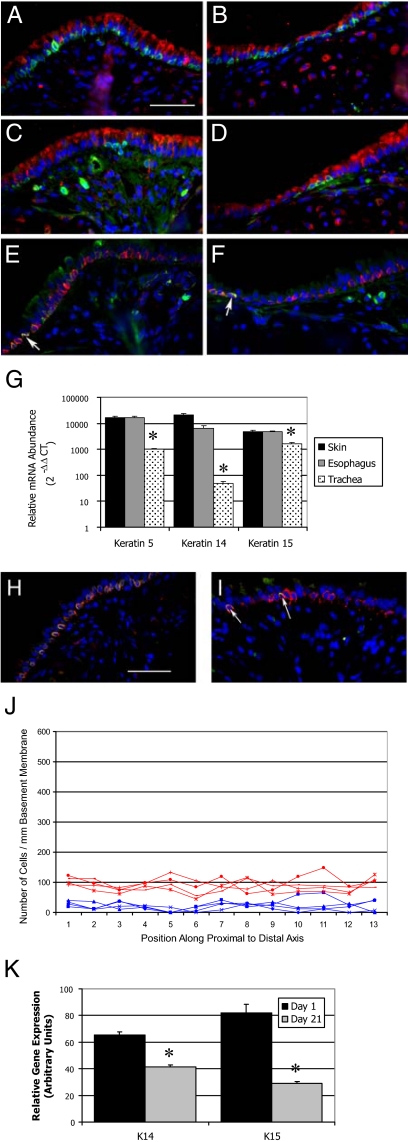
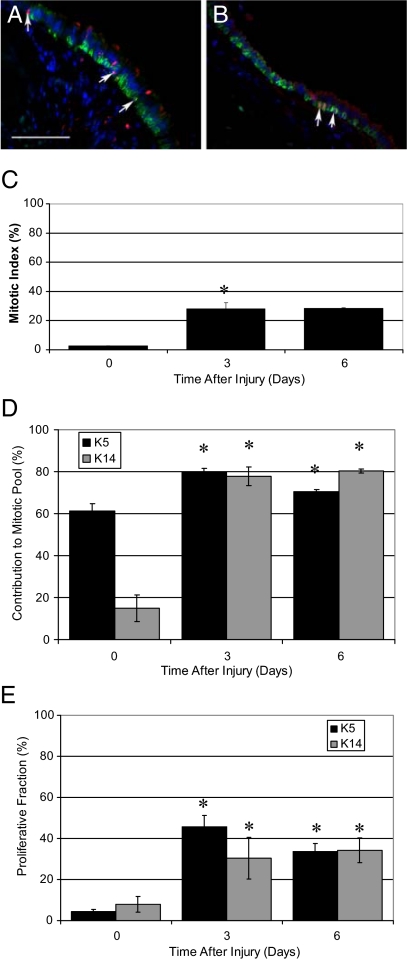
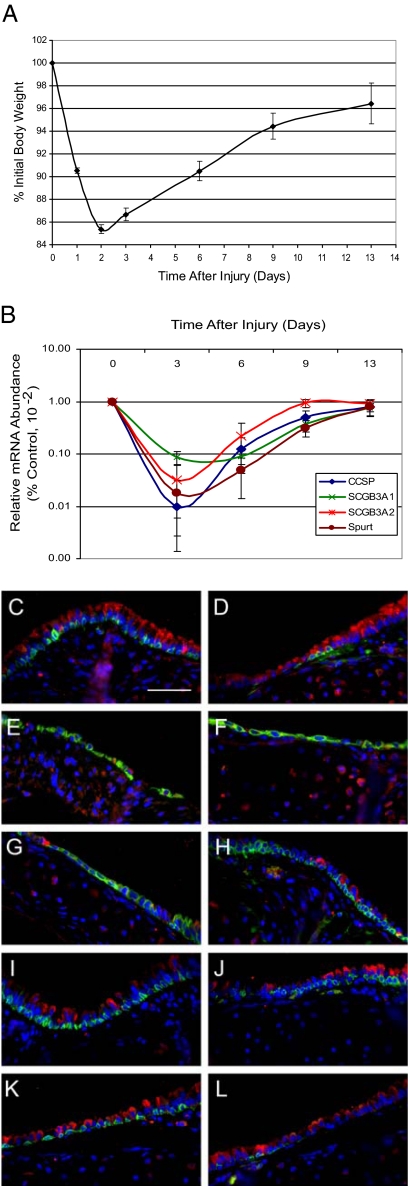
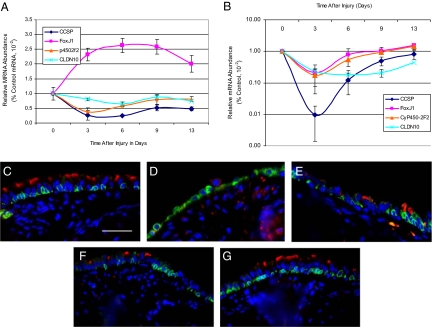
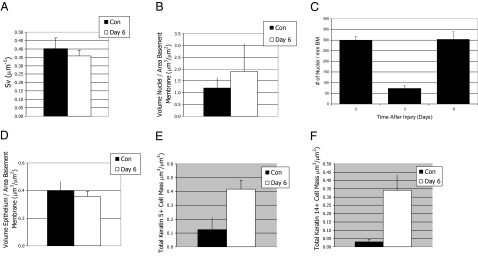
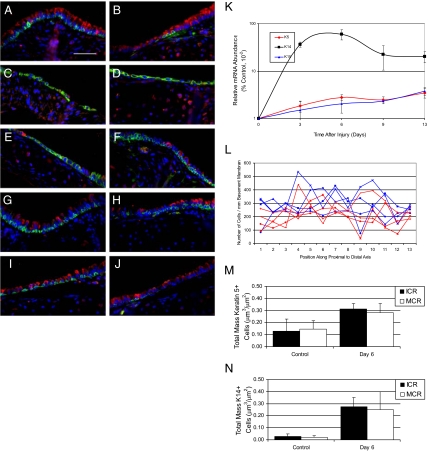
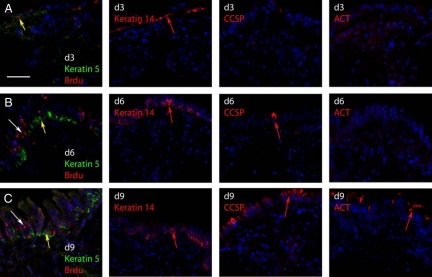
Analysis of lineage relationships in the naphthalene-injured tracheal epithelium demonstrated that two multipotential keratin 14-expressing cells (K14ECs) function as progenitors for Clara and ciliated cells. These K14EC were distinguished by their self-renewal capacity and were hypothesized to reside at the stem and transit amplifying tiers of a tissue-specific stem cell hierarchy. In this study, we used gene expression and histomorphometric analysis of the steady-state and naphthalene-injured trachea to evaluate the predictions of this model. We found that the steady-state tracheal epithelium is maintained by two progenitor cell pools, secretory and basal cells, and the latter progenitor pool is further divided into two subsets, keratin 14-negative and -positive. After naphthalene-mediated depletion of the secretory and ciliated cell types, the two basal cell pools coordinate to restore the epithelium. Both basal cell types up-regulate keratin 14 and generate a broadly distributed, abundant, and highly mitotic cell pool. Furthermore, basal cell proliferation is associated with generation of differentiated Clara and ciliated cells. The uniform distribution of basal cell progenitors and of their differentiated progeny leads us to propose that the hierarchical organization of tracheal reparative cells be revised to include a facultative basal cell progenitor pool.


Figures

Figure 1
Figure 1
Tracheal basal cell phenotype and distribution. A–F: Dual immunofluorescence analysis of basal cell markers in the intercartilagenous (A, C, E) or midcartilagenous (B, D, F) regions. All cells are counterstained with DAPI (blue). A and B: Red-CCSP, green-keratin 5. C and D: Red-CCSP, green-keratin 14. E and F: Red-keratin 5, green-keratin 14. Arrows in E and F indicate keratin 5+/14+ cells. G: Quantitative RT-PCR analysis of keratin mRNA abundance in basal cell-containing tissues. Note log scale. Mean ± SEM, n = 4. *P < 0.005. H: Dual immunofluorescence analysis of keratin 5 (red) and keratin 15 (green). I: Dual immunofluorescence analysis of keratin 14 (red) and keratin 15 (green). Arrows indicate keratin 14 and 15 dual positive cells. J: Morphometric analysis of keratin 5+ (red) and keratin 14+ (blue) cell distribution as a function of position along the proximal to distal axis of the ventral trachea. Analysis of four mice is shown. K: Quantitative RT-PCR analysis of keratin mRNA abundance as a function of age in days. Mean ± SEM, n = 4. *P < 0.005 relative to day 1. Scale bar in A and H = 50 μm.
Figure 2
Figure 2
Analysis of basal cell proliferation. A and B: Dual immunofluorescence analysis of keratin 5 (green) and Ki-67 (red), and DAPI (blue) in the intercartilagenous region (A) and midcartilagenous region (B). Arrows indicate Ki-67–positive cells. C: Mitotic index in control tissue (0) and as a function of time after injury (days three and six). Mean ± SEM, n = 4. *P < 0.05 relative to control. D: Contribution of basal cells (K5) and the keratin 14+ subset (K14) to the mitotic pool in the steady state (0) and after injury (days three and six). Mean ± SEM, n = 4. *P < 0.005 relative to control. E: Proliferative fraction of basal cells (K5) and the keratin 14+ (K14) subset in control (0) and after injury (days three and six). Mean ± SEM, n = 4. *P < 0.05 relative to control. Scale bar in A = 50 μm.
Figure 3
Figure 3
Naphthalene-mediated tracheal injury: Clara cell depletion. A: Body weight change as a function of time after naphthalene exposure. Mean ± SEM, n = 4. Values on recovery days two-nine were significantly different from control, P < 0.05. B: mRNA abundance as a function of time after injury. Clara cell secretory markers: CCSP, SCGB3A1 and 3A2, and SPURT. Note the log scale. Values for days three, six, and nine were significantly different from day 0, P < 0.005. Mean ± SEM, n = 4. C–L: Dual immunofluorescence analysis of cell type-specific markers in the intercartilagenous (C, E, G, I, K) and midcartilagenous (D, F, H, J, L) regions. C and D, Control; E and F, Day three; G and H, day six; I and J, day nine; and K and L, day 13. CCSP (red), keratin 5 (green), and nuclei (blue). Scale bar in C = 50 μm.
Figure 4
Figure 4
Naphthalene-mediated tracheal injury: Ciliated cell depletion. A and B: mRNA abundance in lung (A) and trachea (B) as a function of time after injury. Note the log scale in B. CCSP, SCGB3A2, CyP450-2F2 (p4502F2), and Clauden 10 (CLDN10), FoxJ1. Mean ± SEM, n = 4. Values for days three, six, and nine were significantly different from day 0, P < 0.005. C–G: Dual immunofluorescence analysis of the ciliated cell marker acetylated tubulin (red), keratin 5 (green), and nuclei (blue). C, control; D, day three; E, day six; F, day nine; and G, day 13. Scale bar in C = 50 μm.
Figure 5
Figure 5
Stereological comparison of control and repair day six. A and B: The area of the basement membrane (SV) (A) and the volume fraction of nuclei as a function of basement membrane area (VV/SV) (B) of control (black bars) and naphthalene recovery day 6 (white bars) was evaluated using stereological methods. Mean ± SEM, n = 4. Statistically significant differences were not detected for either parameter. C: Cell density change as a function of time after injury. Measurement is the number of nuclei per unit length basement membrane. Mean ± SEM, n = 4. *P < 0.005 relative to control. D: Mass of the epithelium (VS) in control (black bar) and in naphthalene recovery day 6 (white bar). Mean ± SD, n = 4. Differences are not significant. E and F: The mass (VV/SV) of keratin 5+ cells (E) and the keratin 14+ subset (F) was determined in control (black bars) and naphthalene recovery day 6 (white bars). Mean ± SD, n = 4. The mass of keratin 5+ cells increased fourfold and was significantly different from control, *P = 0.02. The mass of the keratin 14+ subset increased 14-fold and was significantly different from control, *P = 0.007.
Figure 6
Figure 6
Basal cell response to naphthalene-mediated tracheal injury. A–J: Dual immunofluorescence analysis of keratin 5 (red) and keratin 14 (green) in the intercartilagenous (A, C, E, G, I) and midcartilagenous (B, D, F, H, J) regions. Arrows in E and F indicate cells that expressed only keratin 14. K: mRNA abundance as a function of time after injury. Note log scale in K. Keratin (K) 5, 15, and 14. Mean ± SEM, n = 4. All keratin 14 values are significantly different from day 0, P < 0.0005. All keratin 5 and 15 values are significantly different from day 0, P < 0.05. L: Morphometric analysis of keratin 5+ (red) and keratin 14+ (blue) cell distribution as a function of position along the proximal to distal axis of the ventral trachea. Analysis of four mice is shown. M–N: Stereological methods were used to determine the mass of keratin 5+ cells (M) and keratin 14+ cells (N) in the intercartilaginous (ICR) and midcartilaginous (MCR) regions of the control (white bars) and naphthalene recovery day 6 trachea (black bar). Mean ± SD, n = 4. The mass of keratin 5+ cells in the ICR (P = 0.03) and MCR (P = 0.06) was statistically significant. The mass of keratin 14+ cells in the ICR was significant (P = 0.002). Scale bar in A = 50 μm.
Figure 7
Figure 7
Pulse-chase analysis of basal cell proliferation. A–C: Dual immunofluorescence analysis of BrdU and keratin 5 in naphthalene-injured tracheas that were pulsed with BrdU on recovery day three and killed three hours later (day three) or after a three- (day six) or a six-day chase (day nine). Yellow arrows indicate BrdU+/keratin 5+ dual positive cells. White arrows indicate BrdU+ cells that are keratin 5−. Adjacent serial sections to those presented in A–C are labeled d3, d6, and d9, respectively. These sections were stained for keratin 14, CCSP, or ACT. Examples of antigen-positive cells are indicated by red arrows. Scale bar in A = 50 μm.

References

    1. Puchelle E, Zahm JM, Tournier JM, Coraux C. Airway epithelial repair, regeneration, and remodeling after injury in chronic obstructive pulmonary disease. Proc Am Thorac Soc. 2006;3:726–733. - PubMed
    1. Iyonaga K, Miyajima M, Suga M, Saita N, Ando M. Alterations in cytokeratin expression by the alveolar lining epithelial cells in lung tissues from patients with idiopathic pulmonary fibrosis. J Pathol. 1997;182:217–224. - PubMed
    1. Voynow JA, Fischer BM, Roberts BC, Proia AD. Basal-like cells constitute the proliferating cell population in cystic fibrosis airways. Am J Respir Crit Care Med. 2005;172:1013–1018. - PubMed
    1. Chilosi M, Poletti V, Zamo A, Lestani M, Montagna L, Piccoli P, Pedron S, Bertaso M, Scarpa A, Murer B, Cancellieri A, Maestro R, Semenzato G, Doglioni C. Aberrant Wnt/beta-catenin pathway activation in idiopathic pulmonary fibrosis. Am J Pathol. 2003;162:1495–1502. - PMC - PubMed
    1. Araya J, Cambier S, Markovics JA, Wolters P, Jablons D, Hill A, Finkbeiner W, Jones K, Broaddus VC, Sheppard D, Barzcak A, Xiao Y, Erle DJ, Nishimura SL. Squamous metaplasia amplifies pathologic epithelial-mesenchymal interactions in COPD patients. J Clin Invest. 2007;117:3551–3562. - PMC - PubMed

Publication types

MeSH terms