. 2010 Aug;177(2):724-34.
doi: 10.2353/ajpath.2010.090282. Epub 2010 Jun 3.

Potential down-regulation of salivary gland AQP5 by LPS via cross-coupling of NF-kappaB and p-c-Jun/c-Fos

Affiliations

Potential down-regulation of salivary gland AQP5 by LPS via cross-coupling of NF-kappaB and p-c-Jun/c-Fos

Chenjuan Yao et al. Am J Pathol. 2010 Aug.

Abstract

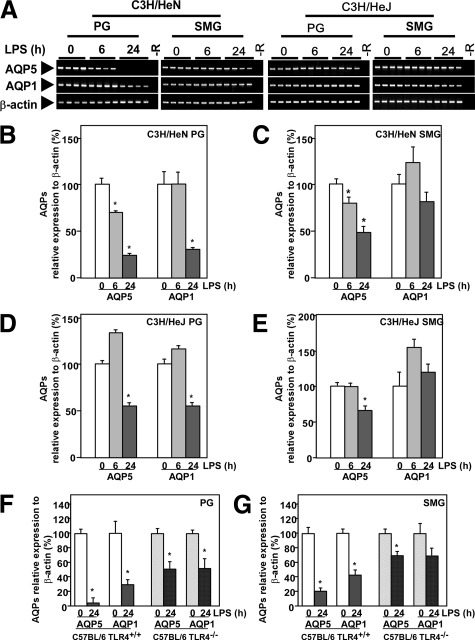
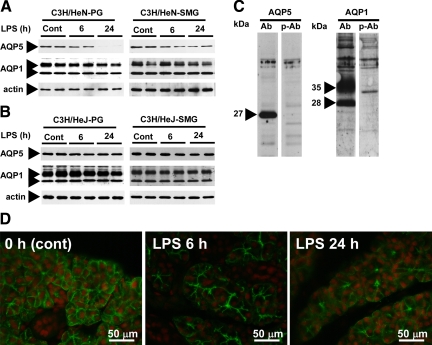
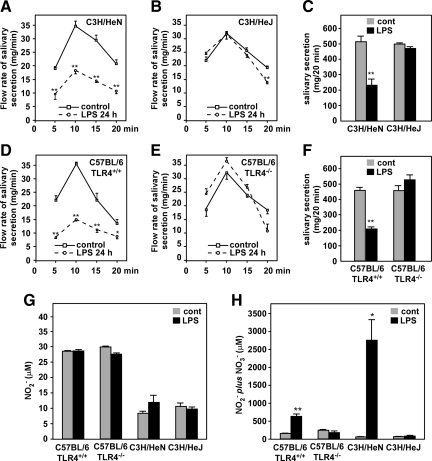
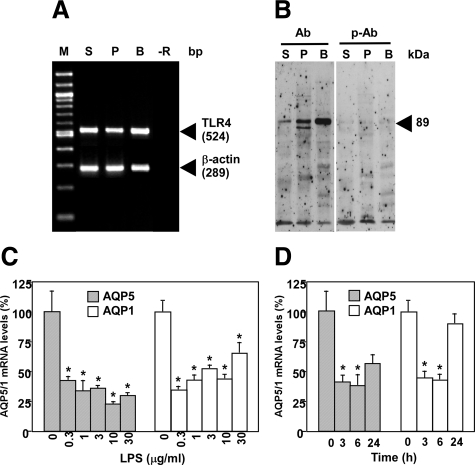
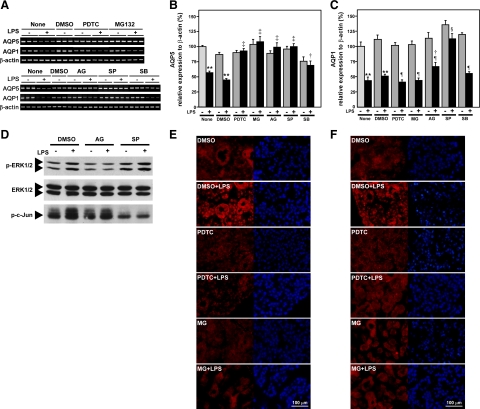
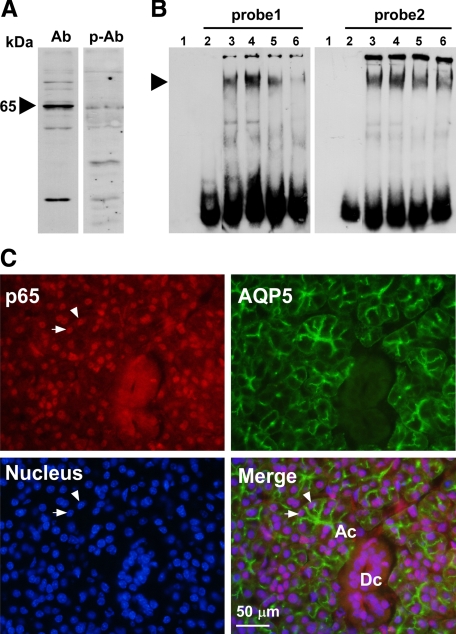
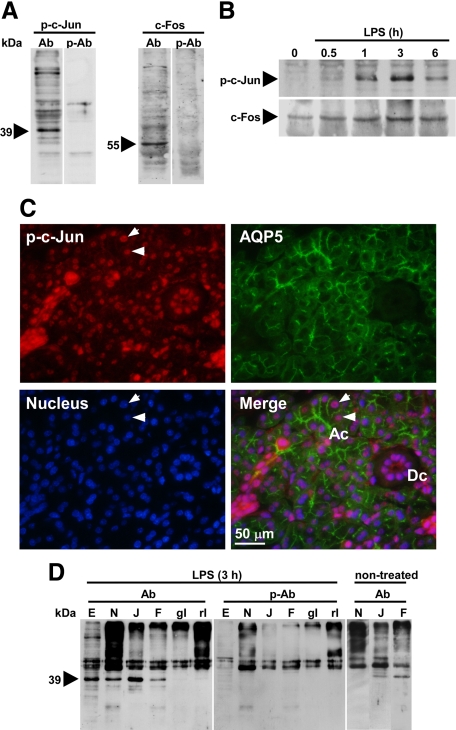
The mRNA and protein levels of aquaporin (AQP)5 in the parotid gland were found to be potentially decreased by lipopolysaccharide (LPS) in vivo in C3H/HeN mice, but only weakly in C3H/HeJ, a TLR4 mutant mouse strain. In the LPS-injected mice, pilocarpine-stimulated saliva production was reduced by more than 50%. In a tissue culture system, the LPS-induced decrease in the AQP5 mRNA level was blocked completely by pyrrolidine dithiocarbamate, MG132, tyrphostin AG126, SP600125, and partially by SB203580, which are inhibitors for IkappaB kinase, 26S proteasome, ERK1/2, JNK, and p38 MAPK, respectively. In contrast, the expression of AQP1 mRNA was down-regulated by LPS and such down-regulation was blocked only by SP600125. The transcription factors NF-kappaB (p65 subunit), p-c-Jun, and c-Fos were increased by LPS given in vivo, whereas the protein-binding activities of the parotid gland extract toward the sequences for NF-kappaB but not AP-1-responsive elements present at the promoter region of the AQP5 gene were increased by LPS injection. Co-immunoprecipitation by using antibody columns suggested the physical association of the three transcription factors. These results suggest that LPS-induced potential down-regulation of expression of AQP5 mRNA in the parotid gland is mediated via a complex(es) of these two classes of transcription factors, NF-kappaB and p-c-Jun/c-Fos.


Figures

Figure 1
Figure 1
Effects of LPS on expression of AQP5 and AQP1 mRNAs in the PG and SMG. A: Agarose electrophoresis of RT-PCR products. −R indicates no added RNA. B–G: mRNA analysis by real-time RT-PCR. A–E: Analysis of mRNA prepared from C3H/HeN and C3H/HeJ mice. F and G: Analysis of mRNA prepared from C57BL/6 (TLR4+/+) and C57BL/6 (TLR4−/−) mice. Data are presented as the mean ± SE of 4 mice. *P < 0.05, significantly different from the control (0 hours).
Figure 2
Figure 2
Effects of LPS on expression of AQP5 and AQP1 proteins in the PG and SMG from C3H/HeN and C3H/HeJ mice. A: C3H/HeN mice. B: C3H/HeJ mice. C: Control experiment using the total membrane fraction of the PG from nontreated C3H/HeN mice. Ab indicates antisera; p-Ab, peptide-preabsorbed antisera. D: Immunohistochemical detection of AQP5 in the PG of C3H/HeN mice that had been injected with LPS at 0, 6, and 24 hours before sacrifice (left, middle, and right pictures, respectively). Green indicates FITC immunofluorescence showing subcellular localization of AQP5; red, propidium iodide showing cell nuclei.
Figure 3
Figure 3
Effects of LPS on salivary secretion and production of serum NO2/NO3 in C3H/HeN, C3H/HeJ, C57BL/6 (TLR4+/+), and C57BL/6 (TLR4−/−) mice. A–F: Pilocarpine-provoked salivary secretion. Solid line indicates control (non LPS-treated group); dashed line, LPS-treated group. Upper graphs, C3H/HeN and C3H/HeJ mice; lower graphs, C57BL/6 (TLR4+/+) and C57BL/6 (TLR4−/−) mice. A, B, D, and E: Time course of salivary secretion. C and F: Total salivary secretion (0–20 minutes after LPS treatment); A–C: C3H/HeN and C3H/HeJ mice. D–F: C57BL/6 (TLR4+/+) and C57BL/6 (TLR4−/−) mice. G and H: Serum NO2 and NO2 plus NO3 levels in C3H/HeN, C3H/HeJ, C57BL/6 (TLR4+/+), and C57BL/6 (TLR4−/−) mice before and after LPS injection. G: NO2 levels. H: Levels of NO2 plus NO3. Data are presented as the mean ± SE of 4 mice. *P < 0.05 and **P < 0.01, significantly different from control at the same time points.
Figure 4
Figure 4
Expression of TLR4 mRNA and protein in the PG and down-regulation of PG AQP5 and AQP1 by LPS in vitro. A, Analysis of the TLR4 mRNA by RT-PCR. M indicates marker (100 bp DNA Ladder); S, SMG; P, PG; B, bladder; −R, no added RNA. B: Western blotting of cytosolic proteins to detect TLR4. Ab indicates anti-TLR4 polyclonal antibody; p-Ab, peptide-preabsorbed anti-TLR4 polyclonal antibody. S, P, and B, SMG, PG, and bladder, respectively. C and D: Real-time RT-PCR analysis of the AQP5 and AQP1 mRNAs in the PG tissues cultured in vitro in the presence and absence of LPS. C: Dose–response curve. The PG tissues were cultured in the presence of the indicated amounts of LPS for 6 hours. D: Time course. The PG tissues were cultured in the presence of 1 μg/ml LPS for the time indicated. *P < 0.05, significantly different from the control (0).
Figure 5
Figure 5
Effects of inhibitors for the NF-κB and MAPK pathways on LPS-induced down-regulation of AQP5 and AQP1 mRNA levels in cultured PG. A: mRNA analysis by RT-PCR. B and C: mRNA analysis by real-time RT-PCR. B: AQP5 levels. C: AQP1 levels. **P < 0.01, significantly different from respective control (no LPS in “None” or “DMSO” group); P < 0.05, P < 0.01, significantly different from the culture given LPS in “None” or “DMSO” group; §P < 0.05, P < 0.01, significantly different from no-LPS group given the same inhibitor. D: Effects of AG126 and SP600125 on LPS-induced phosphorylation of c-Jun and ERK. E and F: Effects of PDTC and MG132 on LPS-induced nuclear translocation of p65 and p50. Red (Alexa Fluor 594) showing p65 (E) or p50 (F) protein; blue (DAPI) showing cell nuclei.
Figure 6
Figure 6
Analysis of NF-κB in the PG. A: Western blotting of the NF-κB protein in a PG nuclear extract from a C3H/HeN mouse injected with LPS 1 hour before sacrifice. Ab indicates anti-p65 polyclonal antibody; p-Ab, peptide-preabsorbed anti-p65 polyclonal antibody. B: EMSA of NF-κB in the PG from nontreated and LPS-injected C3H/HeN mice. probe1, 5′-AGTCTCAGGCACTTCCCTAAGCC-3′; probe 2, 5′-ACTCCCGATCCACTCCCCCGCTCC-3′. Lane 1, no probe and no protein sample; lanes 2–6, experiments in the presence of probe; lane 2, no protein sample; lane 3, nuclear extract from nontreated C3H/HeN mice; lane 4, nuclear extract from LPS-injected C3H/HeN mice; lane 5, nuclear extract from the LPS-injected C3H/HeN mice preincubated with 50-fold molar excess of unlabeled double-stranded oligonucleotide of NF-κB specific probe; lane 6, nuclear extract from an LPS-injected C3H/HeN mouse, with extract preincubated with antibody against p65. An arrowhead indicates the shifted double strand DNA probes. C: Immunohistochemical detection of p65 and AQP5 in the PG of a C3H/HeN mouse that had been injected with LPS 1 hour before sacrifice. Subcellular localization of p65 protein by Alexa Fluor 594 (red, upper left), subcellular localization of AQP5 by FITC immunofluorescence (green, upper right), cell nuclei stained by DAPI (blue, lower left), and a merged picture (lower right) are shown. Ac indicates an acinus; Dc, a duct. Arrowheads indicate typical nuclei of acinar cells showing exact localization of p65 in the nucleus.
Figure 7
Figure 7
Analysis of p-c-Jun and c-Fos in the PG. A: Control experiment using the cytosolic proteins of the PG from C3H/HeN mice injected with LPS 1 hour before sacrifice. Ab indicates anti-p-c-Jun (left) and anti-c-Fos (right); p-Ab, peptide-preabsorbed p-c-Jun antibody (left) and peptide-preabsorbed c-Fos antibody (right). B: Time course of expression of p-c-Jun and c-Fos proteins in the PG of LPS-injected C3H/HeN mice, as detected by Western blotting. C: Immunohistochemical detection of AQP5 and p-c-Jun in the PG of C3H/HeN mice injected with LPS 1 hour before sacrifice. Pictures show subcellular localization of p-c-Jun by Alexa Fluor 594 (red, upper left), subcellular localization of AQP5 by FITC immunofluorescence (green, upper right), cell nuclei stained by DAPI (blue, lower left), and a merged picture (lower right) are shown. Ac indicates an acinus; Dc, a duct. Arrowheads indicate typical nuclei of acinar cells showing exact localization of p-c-Jun in the nucleus. D: Association of p-c-Jun with NF-κB subunit p65 and c-Fos. Eluates from various antibody columns were subjected to Western blotting. Ab indicates anti-p-c-Jun polyclonal antibody; p-Ab, peptide-preabsorbed anti-p-c-Jun polyclonal antibody. E: PG nuclear extract prepared from LPS-injected C3H/HeN mouse (15 μg). N, J, F, gI, and rI, eluates from antibody columns or normal IgG columns. N, rabbit anti-p65 column; J, rabbit anti-p-c-Jun column; F, goat anti-c-Fos column; gI, normal goat IgG column; rI, normal rabbit IgG column. A 0.25-mg aliquot of the PG nuclear extract was applied to the anti–p-c-Jun column, and 1-mg extracts to the other columns.

Similar articles

Cited by

References

    1. Yakata K, Hiroaki Y, Ishibashi K, Sohara E, Sasaki S, Mitsuoka K, Fujiyoshi Y. Aquaporin-11 containing a divergent NPA motif has normal water channel activity. Biochim Biophys Acta. 2007;1768:688–693. - PubMed
    1. Itoh A, Tsujikawa T, Fujiyama Y, Bamba T. Enhancement of aquaporin-3 by vasoactive intestinal polypeptide in a human colonic epithelial cell line. J Gastroenterol Hepatol. 2003;18:203–210. - PubMed
    1. Verkman AS. Physiological importance of aquaporins: lessons from knockout mice. Curr Opin Nephrol Hypertens. 2000;9:517–522. - PubMed
    1. Marinelli RA, Tietz PS, Pham LD, Rueckert L, Agre P, LaRusso NF. Secretin induces the apical insertion of aquaporin-1 water channels in rat cholangiocytes. Am J Physiol Gastrointest Liver Physiol. 1999;276:G280–G286. - PubMed
    1. Steinfeld S, Cogan E, King LS, Agre P, Kiss R, Delporte C. Abnormal distribution of aquaporin-5 water channel protein in salivary glands from Sjögren’s syndrome patients. Lab Invest. 2001;81:143–148. - PubMed

Publication types

MeSH terms