. 2010 Jul 23;329(5990):432-5.
doi: 10.1126/science.1191244. Epub 2010 Jun 3.

The landscape of C. elegans 3'UTRs

Affiliations

The landscape of C. elegans 3'UTRs

Marco Mangone et al. Science. .

Abstract

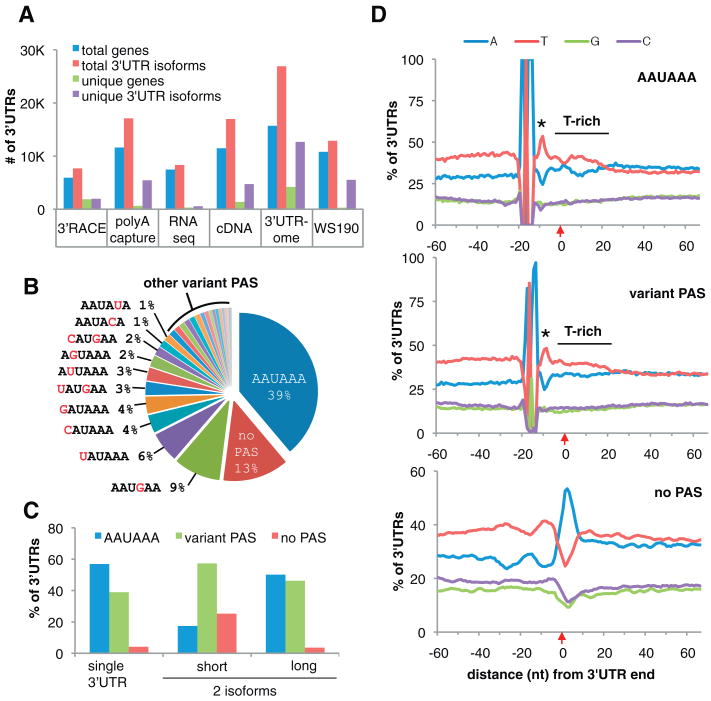
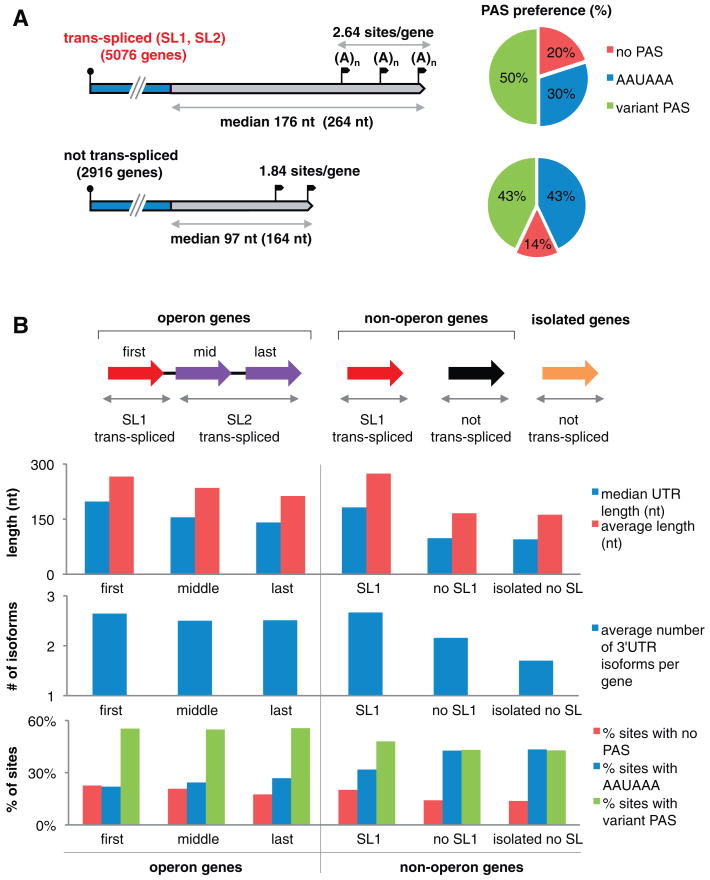
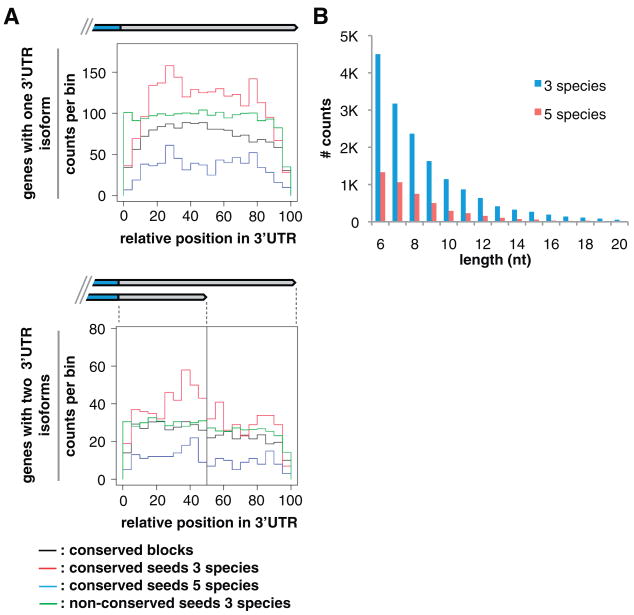
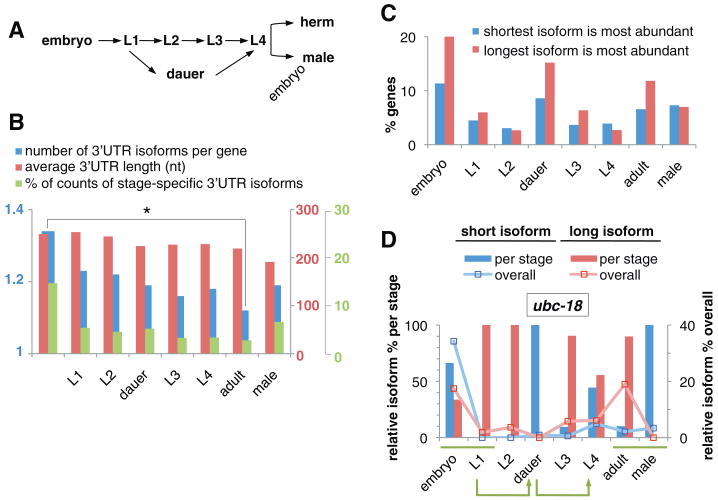
Three-prime untranslated regions (3'UTRs) of metazoan messenger RNAs (mRNAs) contain numerous regulatory elements, yet remain largely uncharacterized. Using polyA capture, 3' rapid amplification of complementary DNA (cDNA) ends, full-length cDNAs, and RNA-seq, we defined approximately 26,000 distinct 3'UTRs in Caenorhabditis elegans for approximately 85% of the 18,328 experimentally supported protein-coding genes and revised approximately 40% of gene models. Alternative 3'UTR isoforms are frequent, often differentially expressed during development. Average 3'UTR length decreases with animal age. Surprisingly, no polyadenylation signal (PAS) was detected for 13% of polyadenylation sites, predominantly among shorter alternative isoforms. Trans-spliced (versus non-trans-spliced) mRNAs possess longer 3'UTRs and frequently contain no PAS or variant PAS. We identified conserved 3'UTR motifs, isoform-specific predicted microRNA target sites, and polyadenylation of most histone genes. Our data reveal a rich complexity of 3'UTRs, both genome-wide and throughout development.


Figures

Fig. 1
Fig. 1
The 3′UTRome and 3′UTR PAS. (A) The number of genes and isoforms detected in, or specific to, each data set and cumulative totals in WS190 and 3′UTRome annotations. (B) PAS motif frequencies: AAUAAA (39%), variant PAS (1 to 9%), and no PAS (13%). (C) PAS usage in genes with one or two (short and long) 3′UTR isoforms. (D) Nucleotide distribution spanning ±60 nt around the polyA addition site, in 3′UTRs with: AAUAAA (top), 10 most common variant PAS (middle), and no PAS (bottom). Alignments, centered at −19 nt, show a T-spike at 5 nt downstream of PAS (asterisk), polyA addition site (red arrow), and T-rich region downstream of cleavage site. The A-rich peak downstream of “no PAS” is not enriched for AAAAAA, suggesting an A-rich motif at that location rather than artifactual A-rich ends.
Fig. 2
Fig. 2
3′UTRs in operons and trans-spliced versus non–trans-spliced mRNAs. (A) Trans-spliced (top) and non–trans-spliced (bottom) mRNAs: 3′UTR median (and average) lengths, number of 3′UTR isoforms per gene (polyA sites, black flags), and PAS preference (pie charts: % 3′UTRs with AAUAAA, variant PAS, and no PAS). (B) (Top) Schematic of operon (left, n = 574 operons), non-operon (center, n = 4348 genes), and isolated (right, n = 2098) genes. Initial operon genes (red) are SL1–trans-spliced; downstream genes (purple) usually acquire one of the other SLs (SL2 to SL12). Non-operon genes are either SL1–trans-spliced (red, n = 3530) or not trans-spliced (black, n = 818). Isolated genes (having no neighbors within 2 kb) are not trans-spliced (orange, n = 2098). (Bottom) 3′UTR lengths, number of isoforms, and PAS sites for operon and non-operon genes.
Fig. 3
Fig. 3
Conserved sequence elements in 3′UTRs. (A) Histogram distributions of conserved sequence blocks (black, counts shown at 1/5th scale), conserved miRNA seeds in three (red; C. elegans, C. remanei, C. briggsae) and five (blue; C. elegans, C. remanei, C. briggsae, C. brenneri, C. japonica) species, and nonconserved miRNA seeds (green, 1/25th scale) along the normalized length of 3′UTRs, in genes with one isoform (top) or exactly two isoforms (bottom). For genes with one isoform, the length scale is 100%; for two isoforms, 0 to 50% represents the short-isoform span, and 51 to 100% indicates the span exclusive to the long isoform. Counts were binned by fraction of total length and, thus, varied in absolute length. (B) Length distribution (up to 20 nt) of conserved sequence blocks in 3′UTRs (excluding miRNA target and PAS sites), in three (blue; n = 16,204 conserved blocks) and five (red; n = 4758) species. See also table S7.
Fig. 4
Fig. 4
3′UTRs during development. (A) C. elegans developmental transitions: embryogenesis, four larval stages, and adults. In unfavorable environments, L1 larvae arrest in dauer stage and can re-enter the life cycle as L4 larvae. herm, hermaphrodites. (B) The number of 3′UTR isoforms per gene decreases significantly during development (blue) (*p ∼ 0.004, permutation test). The average length of 3′UTRs decreases during development (red). Adult males have shorter average 3′UTRs than hermaphrodites. Embryos show more stage-specific 3′UTR isoforms for genes expressed during multiple developmental stages (green) (see table S8). (C) Proportion of genes showing stage-specific expression of alternative 3′UTR isoforms (see table S9). Embryos and dauers favor longer 3′UTR isoforms. (D) Differential 3′UTR-isoform expression during development (ubc-18 shown; see data sets S5 and S6 for details). The bar chart illustrates the relative abundance of short versus long 3′UTR isoforms for ubc-18 in each stage (sum per stage = 100%, left y axis). The line graph shows the relative abundance across all stages (sum per gene across all stages = 100%, right y axis). Green bars highlight differences in 3′UTR isoform usage in the embryo-to-L1 transition and between adult hermaphrodite and male stages. Green arrows indicate dauer entry and exit transitions.

References

    1. de Moor CH, Meijer H, Lissenden S. Semin Cell Dev Biol. 2005;16:49. - PubMed
    1. Wickens M, Bernstein DS, Kimble J, Parker R. Trends Genet. 2002;18:150. - PubMed
    1. Bartel DP. Cell. 2009;136:215. - PMC - PubMed
    1. He L, et al. Nature. 2005;435:828. - PMC - PubMed
    1. Chatterjee S, Pal JK. Biol Cell. 2009;101:251. - PubMed

Publication types

MeSH terms