. 2010 Jul 23;107(2):305-15.
doi: 10.1161/CIRCRESAHA.110.223024. Epub 2010 Jun 3.

Cardiomyogenesis in the adult human heart

Affiliations

Cardiomyogenesis in the adult human heart

Jan Kajstura et al. Circ Res. .

Retraction in

Expression of concern in

  • Expression of Concern.
    [No authors listed] [No authors listed] Circ Res. 2019 Jan 18;124(2):e4-e5. doi: 10.1161/RES.0000000000000241. Circ Res. 2019. PMID: 30582460 No abstract available.
  • Expression of Concern.
    [No authors listed] [No authors listed] Circulation. 2019 Jan 15;139(3):e5-e6. doi: 10.1161/CIR.0000000000000639. Circulation. 2019. PMID: 30615475 No abstract available.

Abstract

Rationale: The ability of the human heart to regenerate large quantities of myocytes remains controversial, and the extent of myocyte renewal claimed by different laboratories varies from none to nearly 20% per year.

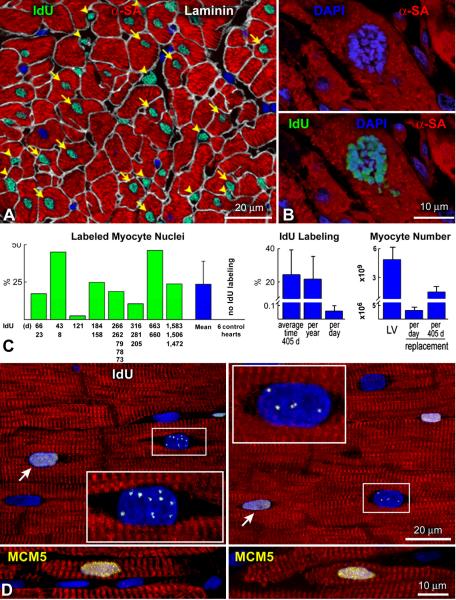
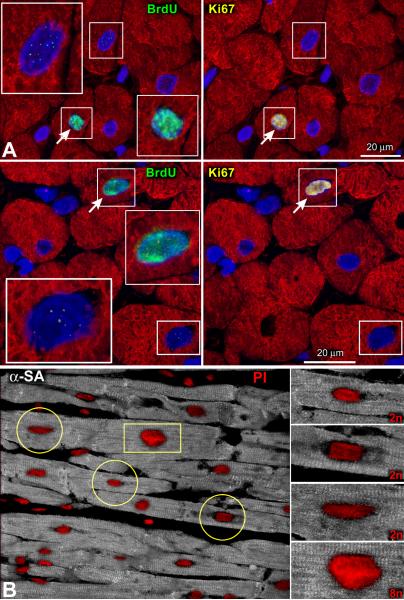
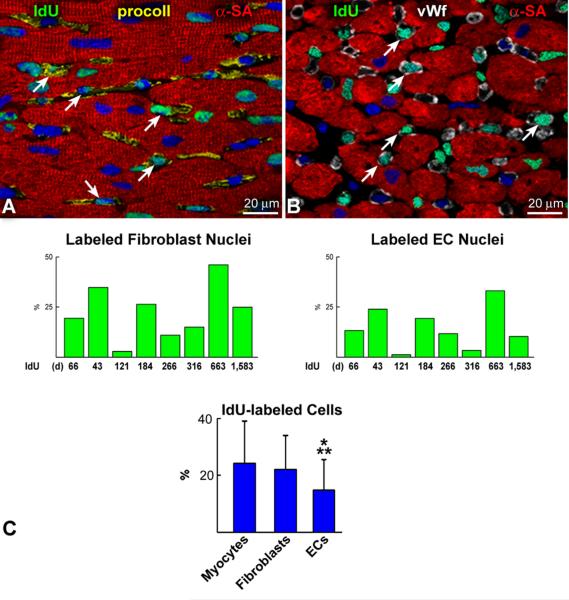
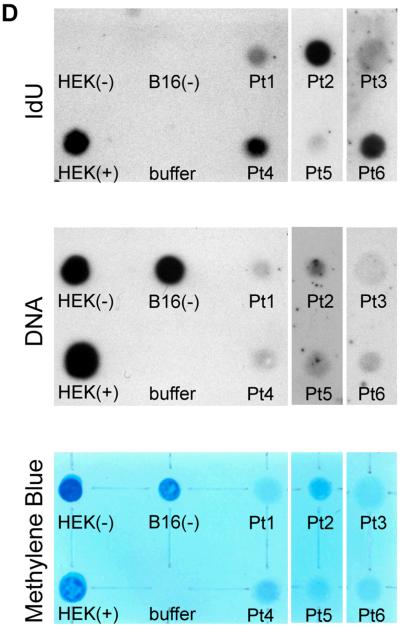
Objective: To address this issue, we examined the percentage of myocytes, endothelial cells, and fibroblasts labeled by iododeoxyuridine in postmortem samples obtained from cancer patients who received the thymidine analog for therapeutic purposes. Additionally, the potential contribution of DNA repair, polyploidy, and cell fusion to the measurement of myocyte regeneration was determined.

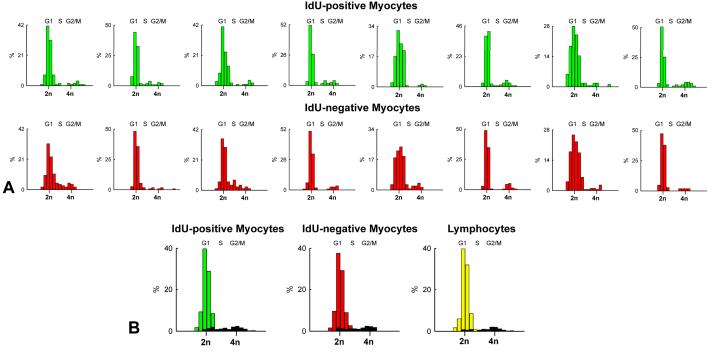
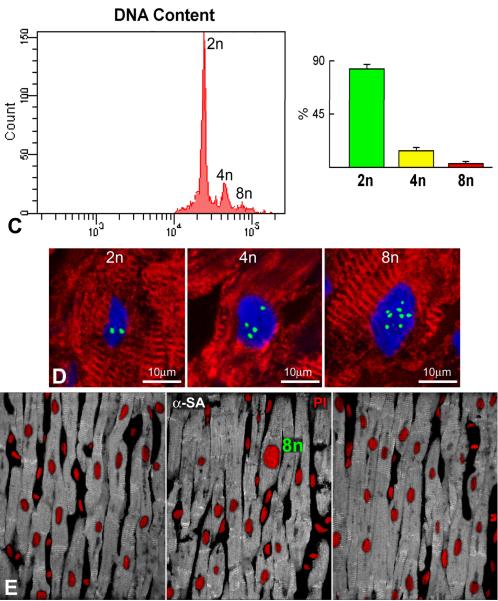
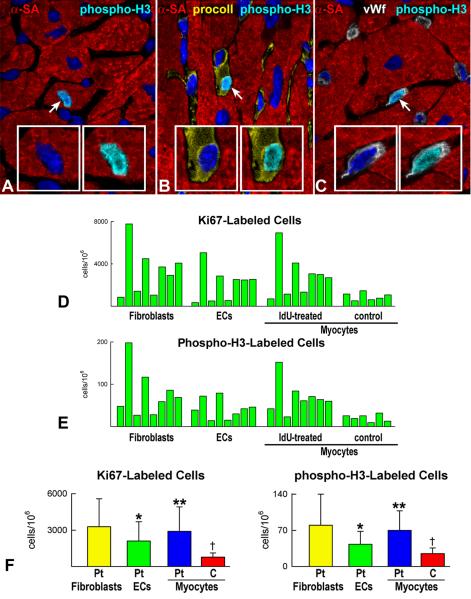
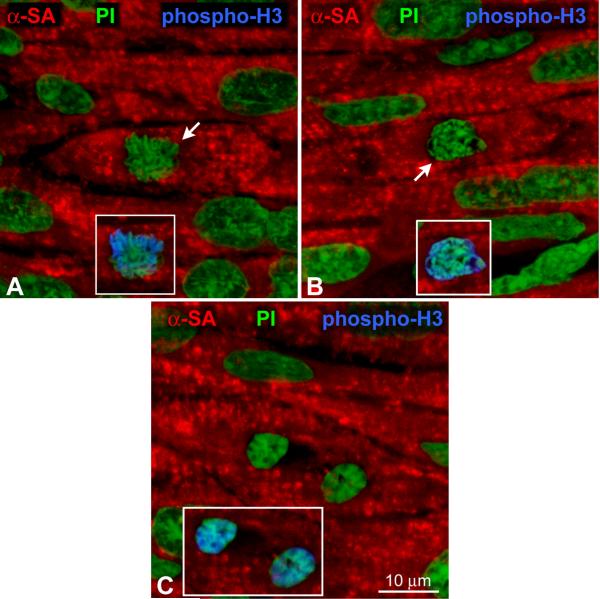
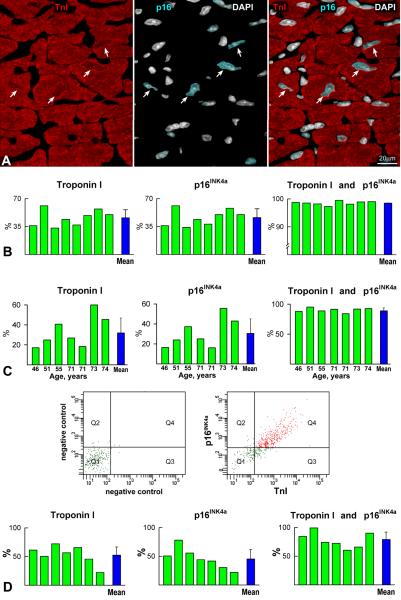
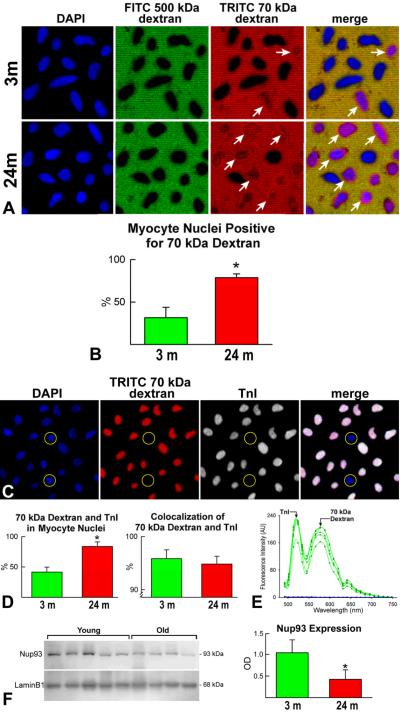
Methods and results: The fraction of myocytes labeled by iododeoxyuridine ranged from 2.5% to 46%, and similar values were found in fibroblasts and endothelial cells. An average 22%, 20%, and 13% new myocytes, fibroblasts, and endothelial cells were generated per year, suggesting that the lifespan of these cells was approximately 4.5, 5, and 8 years, respectively. The newly formed cardiac cells showed a fully differentiated adult phenotype and did not express the senescence-associated protein p16(INK4a). Moreover, measurements by confocal microscopy and flow cytometry documented that the human heart is composed predominantly of myocytes with 2n diploid DNA content and that tetraploid and octaploid nuclei constitute only a small fraction of the parenchymal cell pool. Importantly, DNA repair, ploidy formation, and cell fusion were not implicated in the assessment of myocyte regeneration.

Conclusions: Our findings indicate that the human heart has a significant growth reserve and replaces its myocyte and nonmyocyte compartment several times during the course of life.


Figures

Figure 1
Figure 1. IdU in human cardiomyocytes
A: Several myocyte nuclei (arrows) and non-myocyte nuclei (arrowheads) are labeled by IdU (green). Myocytes are positive for α-sarcomeric actin (α-SA, red). Laminin (white) defines the boundary of myocytes and interstitial cells. B: Metaphase chromosomes in a dividing myocyte nucleus (upper panel) are labeled by IdU (lower panel). C: Percentage of IdU-positive myocyte nuclei in each of the 8 patients injected with the thymidine analog. The interval between each IdU administration and patient’s death is shown. IdU was not detected in control hearts. The average degree of myocyte formation in the 8 patients is also shown. D: Myocyte nuclei included in rectangles show punctuated IdU labeling (white). Diffuse IdU labeling of myocyte nuclei (arrows). Both punctuated and diffuse IdU labeling were negative for MCM5, indicating that DNA synthesis was no longer present at the time of sampling of the myocardium at patient’s death. Positive controls for MCM5 (yellow) are shown in the two small lower panels.
Figure 2
Figure 2. DNA repair and ploidy
A: Punctuated (rectangles) and diffuse (rectangles and arrows) localization of BrdU in myocyte nuclei from fresh samples of human myocardium perfused for ~1 hour with 5μM of the thymidine analog. Ki67 (yellow) is present only in uniformly BrdU-labeled myocyte nuclei. B: The increased intensity of the DNA dye propidium iodide (PI, red) is apparent in the enlarged myocyte nucleus (rectangle), reflecting an octaploid DNA content. Lower levels of PI fluorescence are present in the smaller diploid myocyte nuclei (circles). Myocytes: α-SA, white.
Figure 3
Figure 3. Distribution of DNA content in myocyte nuclei
A and B: Frequency distribution of DNA content in IdU-positive (green bars) and IdU-negative (red bars) cardiomyocytes. Values are shown individually in each of the 8 patients (A) and as an average (B). The fraction of Ki67-positive myocyte nuclei is illustrated in black (B). Lymphocytes from human tonsils were used as control for 2n DNA content (yellow bars). C: Frequency distribution of DNA content in nuclei isolated from pure preparations of human myocytes. D: Three human myocyte nuclei show 2, 4 and 8 X-chromosomes (green dots). E: In these three sections of human myocardium only one octaploid enlarged myocyte nucleus (PI, red) is present. Note the rather uniform size of the large majority of diploid myocyte nuclei. Myocytes: α-SA, white.
Figure 4
Figure 4. IdU in human myocytes and non-myocytes
A and B: IdU labeling (green) of fibroblast nuclei (A: procoll, yellow; arrows) and EC nuclei is shown (B: vWf, white; arrows). C: Percentage of IdU-positive fibroblasts and ECs in each case. Only the interval from the first IdU injection to patient’s death is listed below each bar. Moreover, the percent difference in the degree of IdU labeling of myocytes, fibroblasts and ECs is shown. *P<0.005 vs. myocytes; **P<0.05 vs. fibroblasts. D: Chemiluminescent signals generated by IdU in myocardial samples (upper panel, black dots). Binding of the ss/ds DNA antibody to the membrane (central panel, black dots). Methylene blue staining of the DNA loaded and fixed onto the membrane is shown in the lower panel (blue dots). HEK293 cells cultured with, HEK(+), and without, HEK(−), the thymidine analog were used as positive and negative control, respectively. B16(−), B16 mouse melanoma cells cultured in the absence of the halogenated nucleotide. Buffer, buffer only.
Figure 5
Figure 5. Cell proliferation
A-C: Mitosis in a human myocyte (A), fibroblast (B) and EC (C) is recognized by phospho-H3 labeling (bright blue, arrows). Dividing cells are shown at higher magnification in the insets; DAPI, left insets; phospho-H3, right insets. D and E: Percentage of Ki67 (D) and phospho-H3 (E) labeled fibroblasts, ECs and myocytes in patients exposed to IdU. Values for myocytes in 6 control hearts are also shown. F: Comparison of the average values of Ki67 and phospho-H3 in patients (Pt) treated with IdU. *P<0.05 vs. fibroblasts, **P<0.05 vs. ECs. P<0.05 vs. cardiomyocytes of Pt. C, control hearts.
Figure 6
Figure 6. Myocyte formation in the postnatal human heart
A-C: Metaphase (A, B) and telophase (C) chromosomes (green, arrows) in myocytes (α-SA, red) of a human heart at 2 years of age. Mitoses are labeled by phospho-H3 (insets, blue).
Figure 7
Figure 7. Nuclear TnI and myocyte senescence
A: Section of human myocardium in which TnI in myocyte nuclei (left panel, red, arrows) co-localizes with p16INK4a (central panel, bright blue, arrows); nuclei are stained by DAPI (white). Right panel, merge. B: Expression of TnI and p16INK4a in myocyte nuclei of the 8 patients treated with IdU. C: Expression of TnI and p16INK4a in myocyte nuclei of 7 normal hearts not exposed to IdU. D: Bivariate distribution of co-expression of TnI and p16INK4a in pure preparations of myocyte nuclei. Q1, Nuclei negative for TnI and p16INK4a; Q2, Nuclei positive for p16INK4a only; Q3, Nuclei positive for TnI only; Q4, Nuclei positive for TnI and p16INK4a. Individual values are indicated by green bars and average values by blue bars.
Figure 8
Figure 8. TnI expression and lifespan of cardiac cells
A and B: Myocyte nuclei (DAPI, blue) exclude FITC-500 kDa dextran (negative control, green). TRITC-70-kDa dextran (red) diffuses into a fraction of myocyte nuclei (arrows); this value is higher in nuclei from senescent hearts (B). C: Myocyte nuclei (DAPI, blue) positive for TRITC-70-kDa dextran (red) express TnI (white). Almost all dextran-permeable myocyte nuclei express TnI; unlabeled nuclei (circles). D: Fraction of dextran-TnI-positive myocyte nuclei in young and old hearts; almost all dextran-permeable myocyte nuclei express TnI. E: Emission spectra from myocyte nuclei positive for TRITC-70-kDa dextran and TnI (green lines). Blue lines correspond to autofluorescence of myocyte nuclei negative for TRITC-70-kDa dextran and TnI. F: Nup93 expression in myocyte nuclei. Loading conditions, lamin B1. Expression levels are shown by optical density (OD). *P<0.05.

Similar articles

Cited by

References

    1. Losordo D, Dimmeler S. Therapeutic angiogenesis and vasculogenesis for ischemic disease: part II: cell-based therapies. Circulation. 2004;109:2692–2697. - PubMed
    1. Anversa P, Kajstura J, Leri A, Bolli R. Life and death of cardiac stem cells: a paradigm shift in cardiac biology. Circulation. 2006;113:1451–1463. - PubMed
    1. Smith RR, Barile L, Cho HC, Leppo MK, Hare JM, Messina E, Giacomello A, Abraham HR, Marban E. Regenerative potential of cardiosphere-derived cells expanded from percutaneous endomyocardial biopsy specimens. Circulation. 2007;115:896–908. - PubMed
    1. Bearzi C, Rota M, Hosoda T, Tillmanns J, Nascimbene A, De Angelis A, Yasuzawa-Amano S, Trofimova I, Siggins RW, Cascapera S, Beltrami AP, Zias E, Quaini F, Urbanek K, Michler RE, Bolli R, Kajstura J, Leri A, Anversa P. Human cardiac stem cells. Proc Natl Acad Sci USA. 2007;104:14068–14073. - PMC - PubMed
    1. Hosoda T, D’Amario D, Cabral-Da-Silva MC, Zheng H, Padin-Iruegas ME, Ogorek B, Ferreira-Martins J, Yasuzawa-Amano S, Amano K, Ide-Iwata N, Cheng W, Rota M, Urbanek K, Kajstura J, Anversa P, Leri A. Clonality of mouse and human cardiomyogenesis in vivo. Proc Natl Acad Sci USA. 2009;106:17169–17174. - PMC - PubMed

Publication types

MeSH terms