Review
. 2010 Jul 2;21(26):262001.
doi: 10.1088/0957-4484/21/26/262001. Epub 2010 Jun 4.

Recognition tunneling

Affiliations
Review

Recognition tunneling

Stuart Lindsay et al. Nanotechnology. .

Abstract

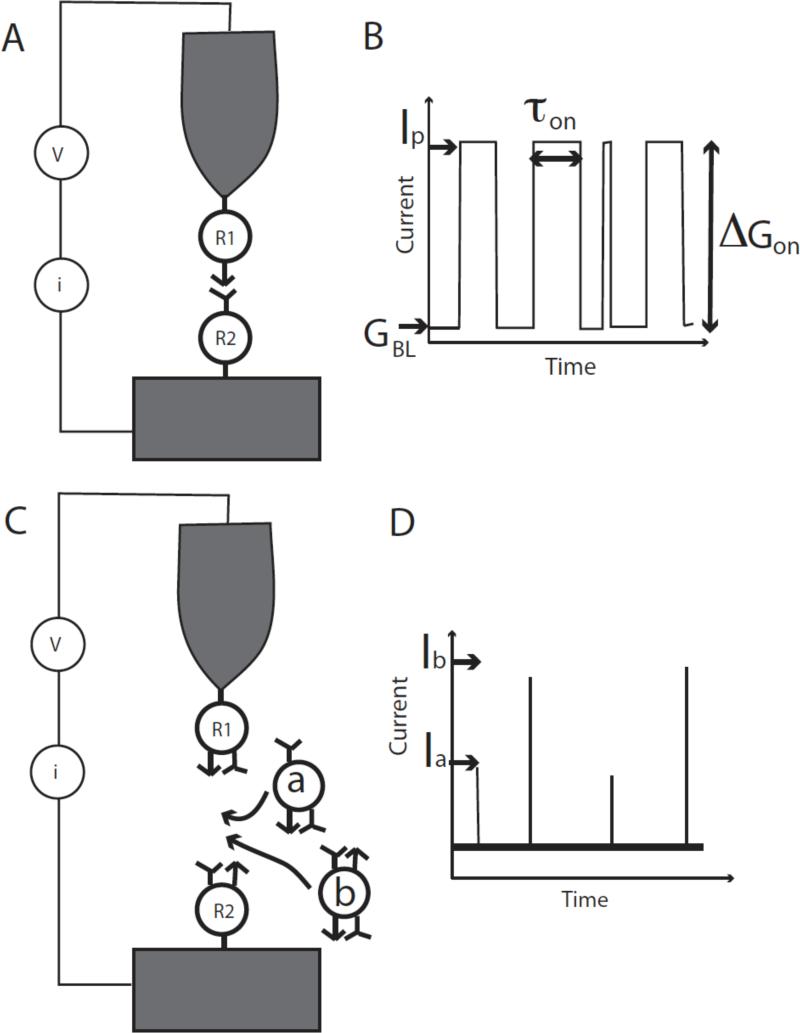
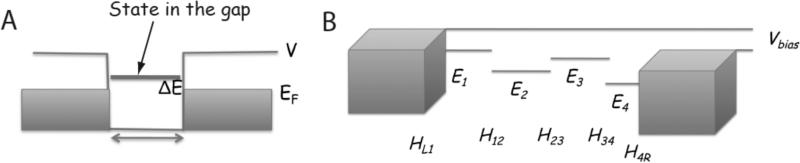
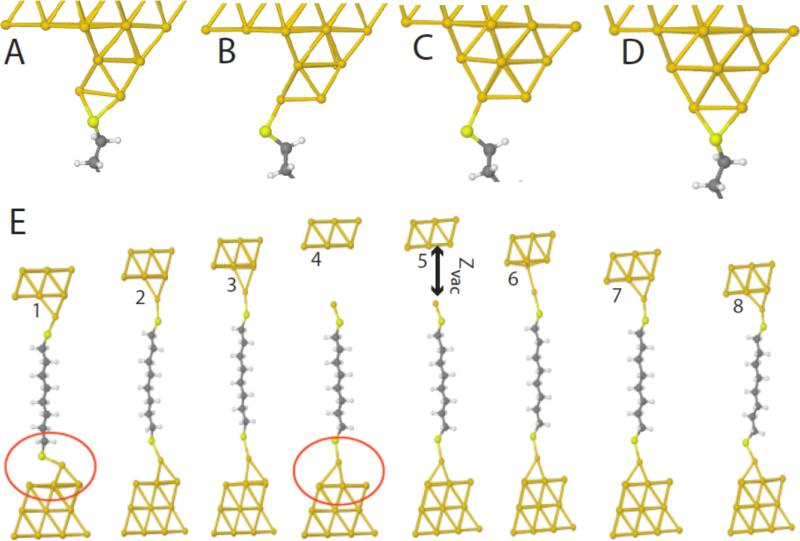
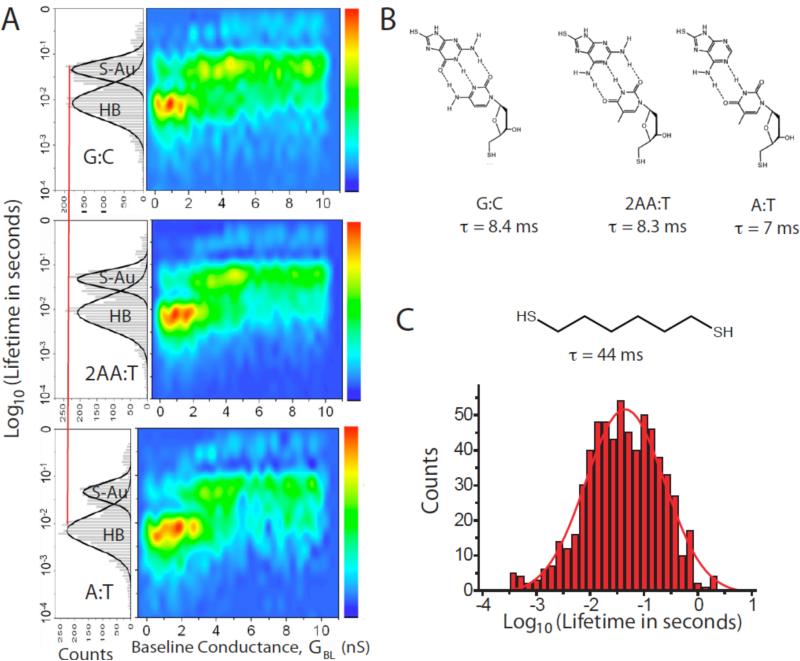
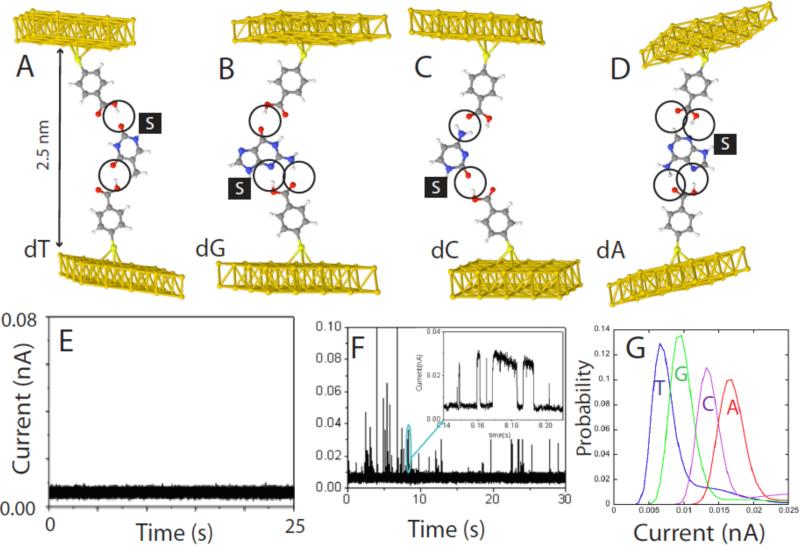
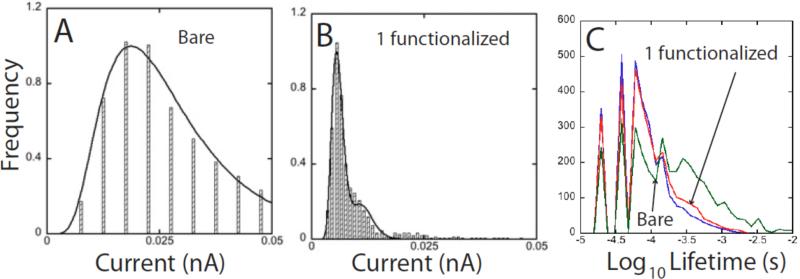
Single molecules in a tunnel junction can now be interrogated reliably using chemically functionalized electrodes. Monitoring stochastic bonding fluctuations between a ligand bound to one electrode and its target bound to a second electrode ('tethered molecule-pair' configuration) gives insight into the nature of the intermolecular bonding at a single molecule-pair level, and defines the requirements for reproducible tunneling data. Simulations show that there is an instability in the tunnel gap at large currents, and this results in a multiplicity of contacts with a corresponding spread in the measured currents. At small currents (i.e. large gaps) the gap is stable, and functionalizing a pair of electrodes with recognition reagents (the 'free-analyte' configuration) can generate a distinct tunneling signal when an analyte molecule is trapped in the gap. This opens up a new interface between chemistry and electronics with immediate implications for rapid sequencing of single DNA molecules.


Figures

Figure 1
Figure 1
Two configurations for Recognition Tunneling. In (A), the tethered molecule-pair junction, the current is recorded as a probe functionalized with a first recognition reagent (R1) is held above a surface functionalized with its bonding partner (R2). (B) Current recorded as a function of time shows switching fluctuations (“telegraph noise”) as the junction between R1 and R2 breaks and remakes. The size of the gap is measured by the “open state current” I0, which corresponds to a baseline conductance for the junction given by GBL = I0/V where V is the junction bias. The change in conductance when the molecule binds to yield a peak conductance (Gp = IP/V), ΔGON = GPGBL, is a measure of the conductance of a single molecule pair. The lifetime of the “bound” state can be measured using the width of the individual jumps in current (τ). A second experimental configuration, the free-analyte configuration, is shown in (B). Here each electrode is functionalized with a reagent that presents recognition sites to a target (R1 and R2, but they could be the same reagent, for example one that presents a hydrogen bond donor and a hydrogen bond acceptor). The tunnel gap is set to a large value such that R1 and R2 do not interact with one another directly. Entry of an analyte into the gap (“a” or “b”) causes a bonded pathway to be formed across the junction, leading to a “spike” in current through the junction (D). If the electron transmission of “a” and “b” differ significantly, their identity can be read directly from the size of the current spikes that are generated (Ia and Ib).
Figure 2
Figure 2
Factors that control the tunneling signal: (A) A simple tunnel barrier shown as a 1D structure with a gap where the potential (V) exceeds the Fermi energy (EF). This potential barrier, V-EF, can be lowered to a value ΔE by the presence of an atom in the gap with an eigenstate at EF+ΔE. The extension of this picture to a molecule in the gap is shown in (B) where each atom contributes a level near the gap E1, E2 .... and overlap between the atomic states (Hmn) leads to a delocalized state that connects the left and right electrodes. This mediates a current proportional to the number of available states on the positive electrode (i.e., proportional to Vbias) and the strength of the coupling between the electrodes, as given by the Green's function propagator.
Figure 3
Figure 3
Hydrogen-bond mediated tunneling. (A) A linear water chain model with one water molecule per unit cell. The H-O·····H angle is 180° and the O····H distance is 0.197 nm (left). The panels on the right show the allowed (real k) and gap (imaginary k or real β) states calculated using complex band structure. (B) Energy minimized configurations for the two Watson-Crick base pairs (G:C, A:T) a GT wobble base pare and a 2-aminoadenine:thymine (2AA:T) pair. Yellow atoms are sulfur atoms that connect to gold slabs. (C) Averaged projected densities of states (DOS) per atom for G--C, A--T, G--T, and 2AA--T base-pairs. The Fermi energy is defined to be zero energy. The projected DOS onto carbon, nitrogen, oxygen, and sulfur atoms are represented in black, blue, red, and orange colors. Solid and broken lines are the projected DOS onto atoms on purines (G, A, 2AA) and pyrimidines (C, T), respectively. The HOMO is dominated by the orbitals on purines (guanine for G-- C and G--T, adenine for A--T, and 2AA for 2AA--T) and the LUMO is dominated by the orbitals on pyrimidines (cytosine for G--C, thymine for G--T, A--T and 2AA--T).
Figure 4
Figure 4
Interpretation of scatter plots of the molecular conductance (ΔGON) vs. the baseline conductance (GBL). (A) shows typical experimental data for a probe functionalized with a base (guanine) interacting with a surface-bound nucleoside (deoxycytidine). The red dashed box encloses a “plateau” region where the majority of the data are relatively constant. As GBL is increased, the number of large conductance points also increases as do the largest values of ΔGON. At the smallest values of GBL there is a region (solid green box) where ΔGONGBL and the data are single valued. Data for octanedithol show the same general features (B). Simulations for octanedithiol (C) reproduce these features. This plot was generated for a series of different contact geometries (A-D, illustrated in figure 5). The scatter increases as GBL is increased in a way that closely resembles the experimental data in (B) (though calculated conductances are higher than the measured conductances). The simulations all converge at small GBL, giving rise to a region where data are single valued and ΔGONGBL, as observed in the experiments. The “plateau region” is less densely occupied in the simulated data, probably because of the limited number of tip geometries explored. In reality, we would expect to find many points around the periphery of the point forming the smallest gap that can accommodate molecules in their equilibrium configuration. The solid line in (C) shows the variation in the gap between the gold atom attached to the sulfur atom and the rest of the gold electrode (Zvac). A nominal contact point (vertical arrow) is defined by the baseline conductance at which the slope of the Zvac curve changes abruptly. This is coincident with the transition from contact-independent conductance to contact dependent conductance. (D) shows data for a dithiol-diphenol. This “stiff” molecule yields no data in the ΔGONGBL regime, presumably because “stretched” configurations are not energetically possible in this molecule.
Figure 5
Figure 5
Contact gepmetries. A-D show contacts of nearly equivalent energy for which the ΔGON vs. GBL curves in Figure 4 were calculated. E1-E8 demonstrate an intrinsic instability in the surface bonding as a function of the tunnel gap size (note the differences between the two configurations circled in red). Note also how the molecule remains “stretched” (4,5 relative to 1,8) even after the bond to the electrode is “broken”, a configuration that is presumably not available to stiffer molecules.
Figure 6
Figure 6
Lifetime distributions from telegraph noise. (A) shows (left) distributions of the “on” state times for three types of DNA base-pairing (B) in a tunnel gap. Two peaks are observed in the distribution. One is a slower process that coincides with the peak that is observed in junctions with only (S-Au)-Au as the labile bonds (see the data for octane dithiol shown in (C)). The faster process is somewhat dependent on the nature of the hydrogen bonding, and is relatively more important in the A:T junctions (two hydrogen bonds) than the 2AA:T and G:C junctions (three hydrogen bonds). The distributions are broken out as a function of baseline conductance in the color plots to the right. Hydrogen bond-breaking is more important in the large gap (small GBL) regime where the molecule is presumably stretched. (S-Au)-Au breaking dominates in smaller gaps.
Figure 7
Figure 7
“Free-analyte” configuration of Recognition Tunneling for reading DNA bases. (A-D) show energy-minimized structures for the four nucleosides bound in a 2.5 nm gap with 4-mercapto benzoic acid as the reading reagent (R1, R2 in Figure 1C). The “S” stands for the deoxyribose sugar (not shown) and the order (dT, dG, dC, dA) corresponds to the predicted order of increasing tunnel conductance using density functional theory. (E) Shows the background tunnel current in organic solvent (trichlorobenzene) with the gap set to GBL = 12 pS (6pA at 0.5V bias). At this gap there is no indication of interactions between the two benzoic acid readers. (F) Shows an example of the current spikes that are observed when a solution of dG is injected into the tunnel junction. The inset shows details of some of the spike on a ms-timescale. Many of them show the telegraph noise switching characteristic of single molecule binding (the slight slope in the “on” level reflects the action of the servo used to control the tunnel gap). (G) Measured distributions of current for the four bases. The order agrees with the density-functional prediction, but the measured currents are larger than predicted. The overlap between reads limits the probability of a correct assignment on a single read to about 60%.
Figure 8
Figure 8
Current distributions and binding modes: (A) Shows the current distribution measured for a pair of bare gold electrodes for dG. GBL was increased to 20 pS to obtain these reads. (B) Shows the current distribution for dG with just one electrode functionalized. (C) Shows the distribution of on-state lifetimes for bare electrodes (blue), one electrode functionalized (red) and both electrodes functionalized (green). The fine structure reflects data binning. The three distributions are similar, implying that the narrowing that occurs on functionalizing one electrode comes from a smaller range of bound configurations in the gap and not a slowing of DNA motion.

Similar articles

Cited by

References

    1. Hamers RJ, Tromp RM, Demuth JE. Surface Electronic Structure of Si (111)-(7×7) Resolved in Real Space. Phys. Rev. Lett. 1986;56:1972–1975. - PubMed
    1. Hipps KW. Handbook of Applied Solid State Spectroscopy. Kluwer; Berlin: 2005. Scanning Tunneling Spectroscopy. in press.
    1. Shapir E, Cohen H, Calzolari A, Cavazzoni C, Ryndyk DA, Cuniberti G, Kotlyar A, Felice RD, Porath D. Electronic structure of single DNA molecules resolved by transverse scanning tunnelling spectroscopy. Nature Materials. 2008;7:68–74. - PubMed
    1. Tanaka H, Kawai T. Partial sequencing of a single DNA molecule with a scanning tunnelling microscope. Nature Nanotechnology. 2009;4:518–522. - PubMed
    1. Kuznetsov AM, Ulstrup J. Electron transfer in chemistry and biology. Wiley; New York: 1999.

Publication types