. 2010 May 27;5(5):e10870.
doi: 10.1371/journal.pone.0010870.

Genome-wide identification of calcium-response factor (CaRF) binding sites predicts a role in regulation of neuronal signaling pathways

Affiliations

Genome-wide identification of calcium-response factor (CaRF) binding sites predicts a role in regulation of neuronal signaling pathways

Andreas R Pfenning et al. PLoS One. .

Abstract

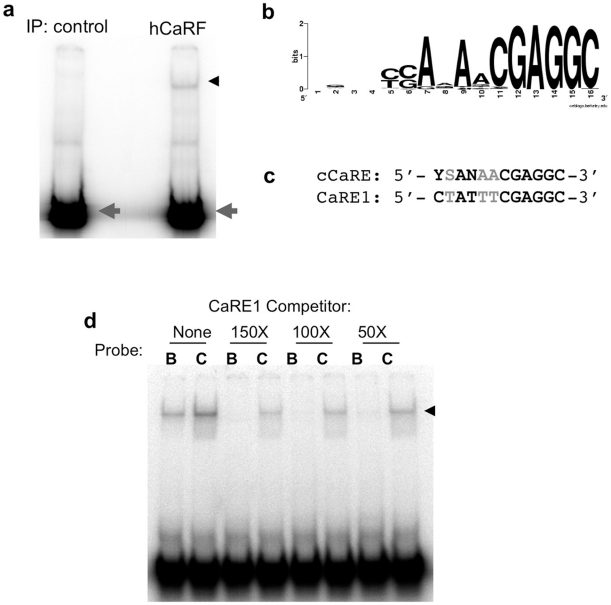
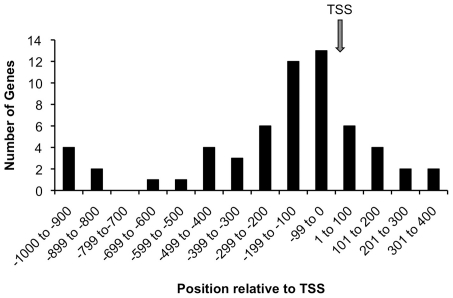
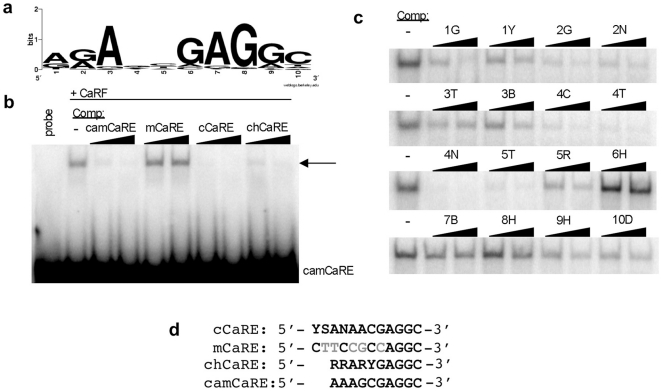
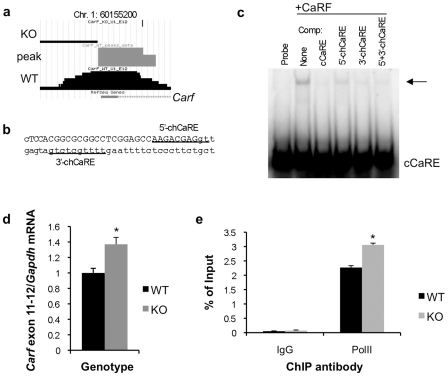
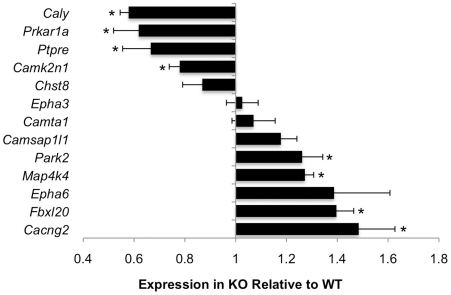
Calcium-Response Factor (CaRF) was first identified as a transcription factor based on its affinity for a neuronal-selective calcium-response element (CaRE1) in the gene encoding Brain-Derived Neurotrophic Factor (BDNF). However, because CaRF shares no homology with other transcription factors, its properties and gene targets have remained unknown. Here we show that the DNA binding domain of CaRF has been highly conserved across evolution and that CaRF binds DNA directly in a sequence-specific manner in the absence of other eukaryotic cofactors. Using a binding site selection screen we identify a high-affinity consensus CaRF response element (cCaRE) that shares significant homology with the CaRE1 element of Bdnf. In a genome-wide chromatin immunoprecipitation analysis (ChIP-Seq), we identified 176 sites of CaRF-specific binding (peaks) in neuronal genomic DNA. 128 of these peaks are within 10kB of an annotated gene, and 60 are within 1kB of an annotated transcriptional start site. At least 138 of the CaRF peaks contain a common 10-bp motif with strong statistical similarity to the cCaRE, and we provide evidence predicting that CaRF can bind independently to at least 64.5% of these motifs in vitro. Analysis of this set of putative CaRF targets suggests the enrichment of genes that regulate intracellular signaling cascades. Finally we demonstrate that expression of a subset of these target genes is altered in the cortex of Carf knockout (KO) mice. Together these data strongly support the characterization of CaRF as a unique transcription factor and provide the first insight into the program of CaRF-regulated transcription in neurons.


Conflict of interest statement

Competing Interests: The authors have declared that no competing interests exist.

Figures

Figure 1
Figure 1. The CaRF DNA binding domain is highly conserved across evolution.
CaRF amino acid sequences were obtained from the NCBI and Ensembl databases by BLAST similarity to mammalian CaRF (Table S2). Sequences were aligned using ClustalW. a) Phylogram representing the evolutionary distances between CaRF sequences in six species. b) Percent identity and similarity among amino acids in each domain of CaRF. The diagrams are drawn to scale and show four distinct domains of CaRF . From left to right these are the N-terminus (corresponding to human coding exons 1–5), the DNA binding domain and nuclear localization signal (DBD/NLS, coding exons 6–7), an intermediate domain (coding exons 8–10), and the transcriptional activation domain (TAD, coding exons 11–14). The numbers between each pair of sequences show the percent of amino acids within that domain that are identical/conserved between that pair within each domain. Identity and conservation of amino acids were called by ClustalW, and insertions were scored as non-conserved amino acids. c) Sequence alignment of the DBD/NLS domain across all six species. Identical amino acids are highlighted black, conserved amino acids are gray and nonconserved changes are white.
Figure 2
Figure 2. CaRF binds DNA directly.
Human CaRF was expressed in bacteria (E. Coli hCaRF) or synthesized in vitro by TNT (hCaRF). Rabbit reticulocyte lysate without CaRF expression was used as control. 2µL of CaRF protein or TNT control was incubated with radiolabeled CaRE1 oligos in the absence (-) or presence of a 50-fold molar excess of competing unlabeled wildtype (W) or mutant (M) CaRE1 probe. Unbound probe is at the bottom of the gel. Arrowhead indicates the complex between CaRF and CaRE1.
Figure 3
Figure 3. Identification of a consensus CaRF binding element.
hCaRF synthesized by TNT (hCaRF) or control rabbit reticulocyte without CaRF (control) was used to coprecipitate oligonucleotides from a library of random 16mers. a) After four rounds of enrichment and amplification, the final pulldown from each sample was radiolabeled and mixed with hCaRF for evaluation by EMSA. Equal amounts of radiolabeled oligos are present in each pool (gray arrowhead), however a CaRF binding band is retarded only from the pool that was isolated by coprecipitation with hCaRF (black arrowhead). b) WebLogo (http://weblogo.berkeley.edu/) representation of the cCaRE consensus motif derived from the 62 sequences in Table S3. The position of the bases is indicated along the bottom from 1–16, and the height of the letters indicates the enrichment of that base at each position. If all four bases were equally likely to be present at any position, no base is indicated. c) Alignment of the cCaRE and CaRE1 motifs. Black indicates bases that are conserved between the elements, and gray shows bases that vary. Y = C/T, S = C/G, and N = any base. d) Comparison of the affinity of CaRF for CaRE1 and cCaRE. A constant amount of hCaRF was bound to radiolabeled CaRE1 (B) or cCaRE (C) probes and the relative affinity of the interactions were assessed by competition EMSA upon the addition of a 150, 100, or 50-fold molar excess of unlabeled CaRE1 probe. The band retarded upon CaRF binding is indicated by the arrowhead.
Figure 4
Figure 4. CaRF ChIP-Seq peaks are enriched near transcription start sites.
The ChIP peaks from Table S4 were viewed in the UCSC genome browser (http://genome.ucsc.org) and the distance from the center of each peak to the nearest annotated transcription start site (TSS) was calculated. For the 60 peaks within 1kB of a TSS we tallied the number within each 100bp. The arrow shows the position of the TSS.
Figure 5
Figure 5. Identification and characterization of a conserved CaRF-binding motif in the CaRF ChIP-Seq peaks.
a) WebLogo (http://weblogo.berkeley.edu/) representation of the 10bp motif discovered by the PRIORITY motif finder in the ChIP peak sequences. The height of each letter represents the enrichment of that base at each position. If all four bases are equally represented, no base is shown at that position. b) Competition EMSA analysis of CaRF binding to the consensus chCaRE motif in the ChIP peak of the Camk2n1 gene (camCaRE). Arrow indicates the CaRF-camCaRE complex, and the right triangles indicate increasing concentrations (50 or 100 fold molar excess) of the unlabeled competitor probes. c) Competition EMSA analysis to examine the relative importance of each base across the 10bp chCaRE motif. Recombinant CaRF was incubated with radiolabeled camCaRE in the absence (-) or presence of a 50 or 100-fold molar excess of unlabeled competitor probes. The right triangle indicates increasing competitor concentrations. Competitor probes were based on the camCaRE sequence (AAAGCGAGGC) with the indicated changes at each position (e.g. 1G has a G rather than an A at position 1 of the motif while the rest of the motif is unchanged). Degenerate code: Y = C/T, N = A,C,G, or T, B = C,G, or T, R = A/G, H = A, C, or T, D = A, G, or T. d) Alignment of the cCaRE, mCaRE, chCaRE, and camCaRE sequences. The mCaRE, which fails to bind CaRF, differs from the CaRF binding sequences at 5 positions, which are shown in gray. Degenerate bases are as described above along with S = C/G.
Figure 6
Figure 6. CaRF regulates Carf transcription in neurons.
a) Primary data from the UCSC genome browser (http://genome.ucsc.edu) showing the CaRF ChIP peak overlapping exon 1 of the Carf gene. b) Position of CaRF-binding motifs in the CaRF ChIP peak from the Carf gene. Capital letters denote exon 1. The underlined sequences show the two potential CaRF-binding motifs. The more 3′ motif in intron 1 was identified by the PRIORITY motif finder. c) Competition EMSA analysis demonstrates that CaRF can bind both motifs in the Carf ChIP peak. Recombinant CaRF was bound to a radiolabeled cCaRE probe in the absence (-) or presence of a 100-fold molar excess of competitor probes. Arrow indicates the CaRF-cCaRE complex. Unlabeled probes used as competitors are listed across the top. d) Expression of Carf mRNA in a Carf exon 8 KO mouse. Cortical neurons from individual P0 WT or CaRF exon 8 deleted (KO) mice were cultured for 5 days, treated with 1µM TTX overnight, then RNA was harvested for cDNA synthesis and quantitative PCR. Carf mRNA was detected with primers against exons 11–12 distal to the deleted region in Carf. Carf mRNA expression was normalized for expression of Gapdh in the same sample to control for sample handling. e) Chromatin immunoprecipitation for RNA polymerase II on the Carf promoter. Carf promoter DNA co-precipitated with an anti-RNA polymerase II antibody or control IgG was quantitated by Q-PCR, and normalized as a percent of signal in the input DNA. Bars show the mean and error bars show SEM. *p<0.05.
Figure 7
Figure 7. Altered expression of a subset of the putative CaRF target genes in Carf knockout mice.
RNA from P0 cortex of Carf WT or KO was processed for quantitative PCR using primers against a subset of the putative CaRF target genes. In each case, mRNA expression was normalized for expression of Gapdh in the same sample to control for sample handling. Data are displayed as expression in KO brains relative to expression in WT brains. A value of 1 indicates no difference in expression, whereas values less than 1 indicate reduced expression in KO compared with WT, and values greater than 1 indicate increased expression in KO compared with WT. n = 4–6 for each genotype. Bars show the mean and error bars represent S.E.M. *p<0.05 for KO compared with WT.

Similar articles

Cited by

References

    1. Vaquerizas JM, Kummerfeld SK, Teichmann SA, Luscombe NM. A census of human transcription factors: function, expression and evolution. Nat Rev Genet. 2009;10:252–263. - PubMed
    1. Ross SE, Greenberg ME, Stiles CD. Basic helix-loop-helix factors in cortical development. Neuron. 2003;39:13–25. - PubMed
    1. Hummler E, Cole TJ, Blendy JA, Ganss R, Aguzzi A, et al. Targeted mutation of the CREB gene: compensation within the CREB/ATF family of transcription factors. Proc Natl Acad Sci U S A. 1994;91:5647–5651. - PMC - PubMed
    1. Levine M, Tjian R. Transcription regulation and animal diversity. Nature. 2003;424:147–151. - PubMed
    1. Farnham PJ. Insights from genomic profiling of transcription factors. Nature Reviews Genetics. 2009;10:605–616. - PMC - PubMed

Publication types

MeSH terms