. 2010 May 27;6(5):e1000792.
doi: 10.1371/journal.pcbi.1000792.

Identifying tightly regulated and variably expressed networks by Differential Rank Conservation (DIRAC)

Affiliations

Identifying tightly regulated and variably expressed networks by Differential Rank Conservation (DIRAC)

James A Eddy et al. PLoS Comput Biol. .

Abstract

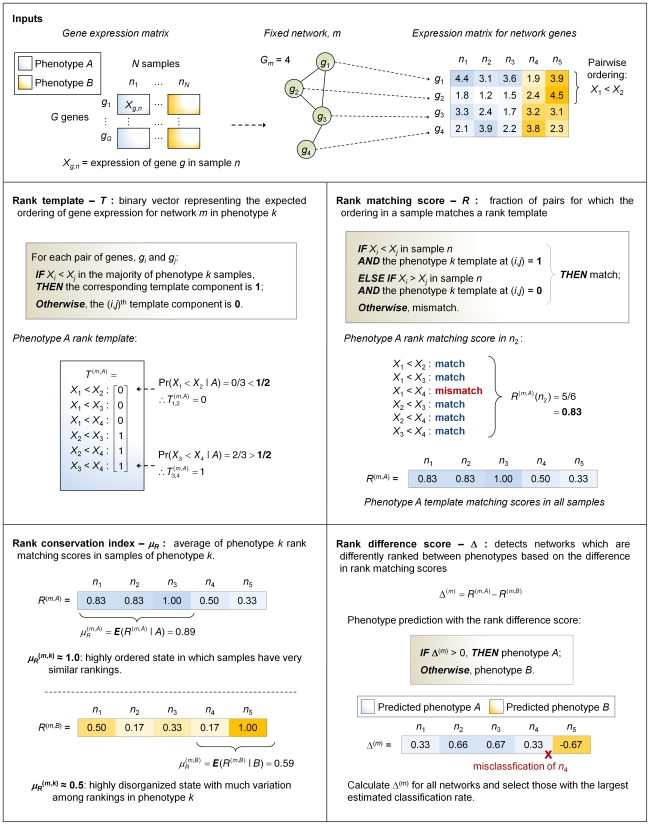
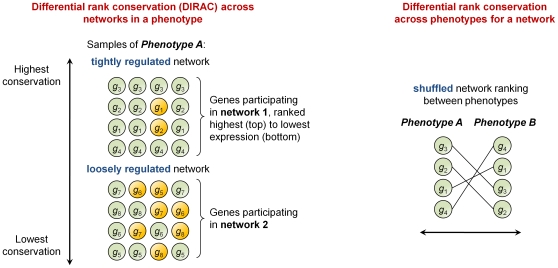
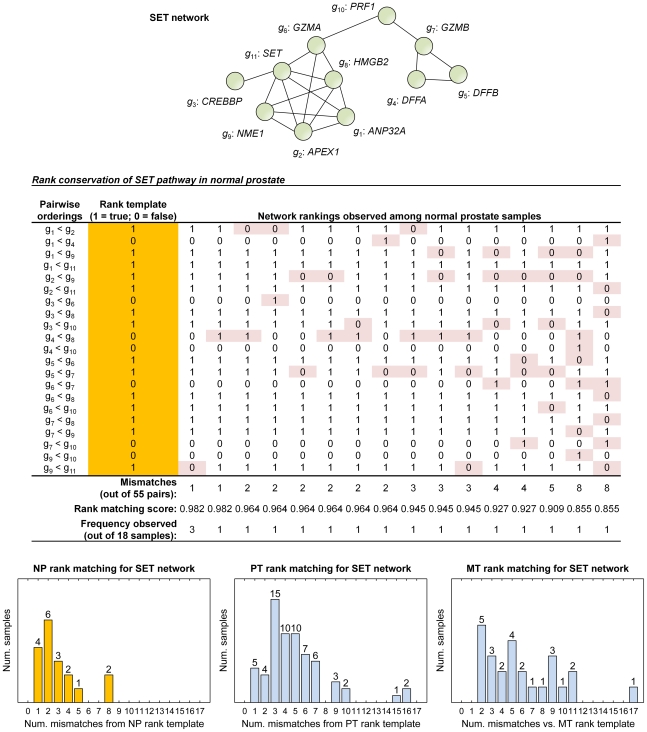
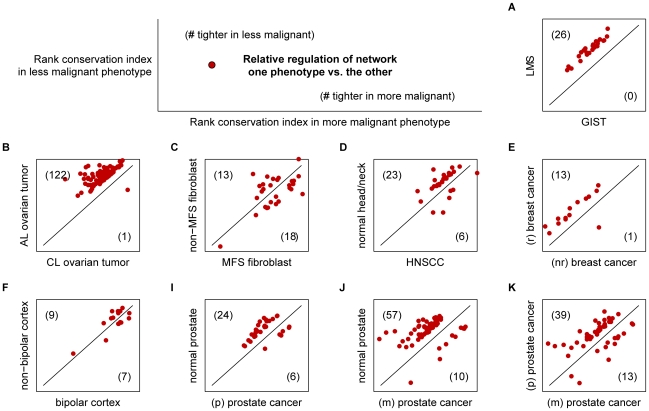
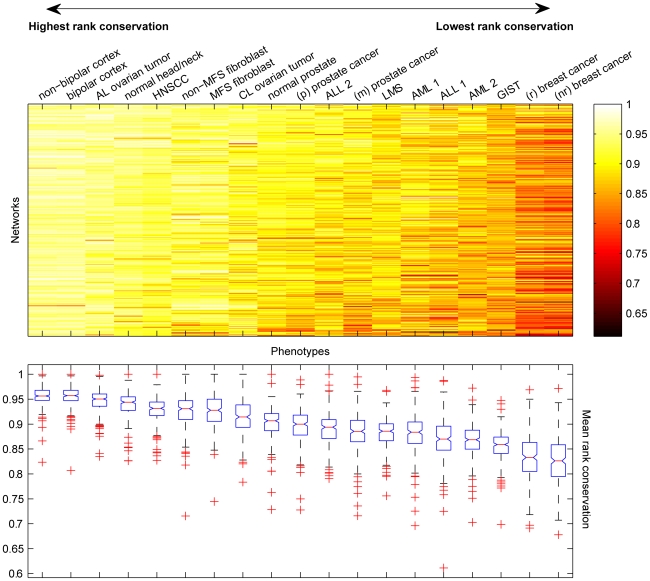
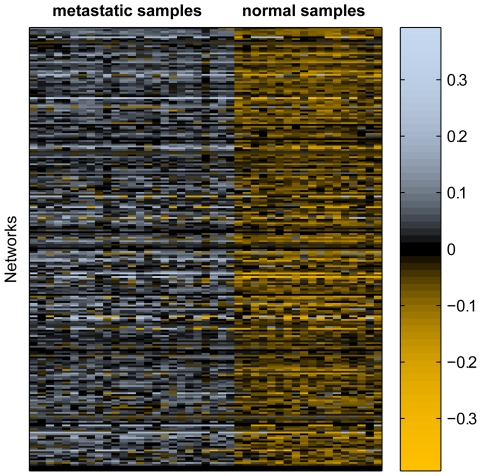
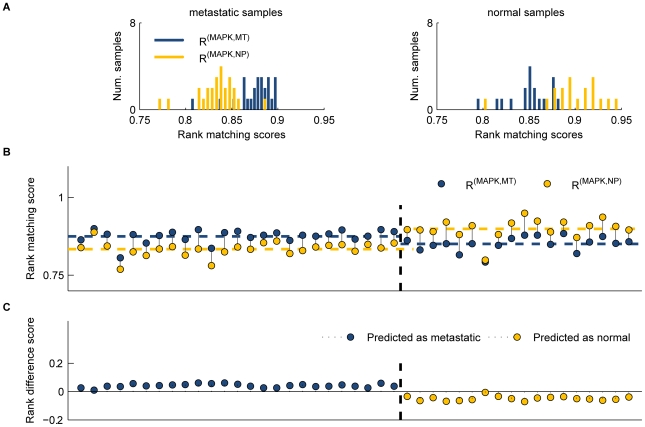
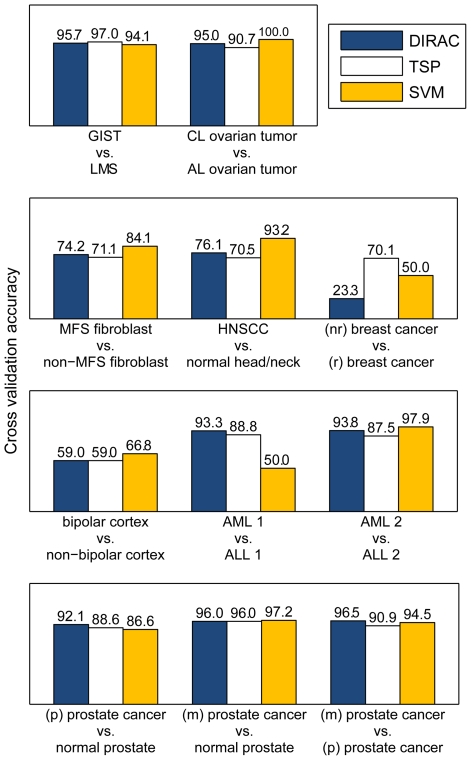
A powerful way to separate signal from noise in biology is to convert the molecular data from individual genes or proteins into an analysis of comparative biological network behaviors. One of the limitations of previous network analyses is that they do not take into account the combinatorial nature of gene interactions within the network. We report here a new technique, Differential Rank Conservation (DIRAC), which permits one to assess these combinatorial interactions to quantify various biological pathways or networks in a comparative sense, and to determine how they change in different individuals experiencing the same disease process. This approach is based on the relative expression values of participating genes-i.e., the ordering of expression within network profiles. DIRAC provides quantitative measures of how network rankings differ either among networks for a selected phenotype or among phenotypes for a selected network. We examined disease phenotypes including cancer subtypes and neurological disorders and identified networks that are tightly regulated, as defined by high conservation of transcript ordering. Interestingly, we observed a strong trend to looser network regulation in more malignant phenotypes and later stages of disease. At a sample level, DIRAC can detect a change in ranking between phenotypes for any selected network. Variably expressed networks represent statistically robust differences between disease states and serve as signatures for accurate molecular classification, validating the information about expression patterns captured by DIRAC. Importantly, DIRAC can be applied not only to transcriptomic data, but to any ordinal data type.


Conflict of interest statement

The authors have declared that no competing interests exist.

Figures

Figure 1
Figure 1. Overview of Differential Rank Conservation (DIRAC) methods.
Figure 2
Figure 2. Prototypical scenarios observed for networks in DIRAC.
Figure 3
Figure 3. Example of a tightly regulated network in normal prostate.
A simplified diagram of the SET network, comprising 11 signaling proteins involved in granzyme mediated apoptosis, is shown in the center. The NP rank template for the network is highlighted yellow, and each unique ranking observed in NP samples is shown to the right with mismatches highlighted red. The histograms at the bottom demonstrate the increased variation in ranking in PT and MT, indicated by greater number of mismatches from the respective rank templates.
Figure 4
Figure 4. Deregulation of networks in disease.
For each dataset, networks were selected according to the greatest absolute difference in rank conservation between the two phenotypes. Using this subset of networks, the rank conservation index values in the less malignant phenotype (y-axis) were plotted against indices in the more malignant phenotype (x-axis). Higher rank conservation in the less or more malignant phenotypes is indicated by points above or below the diagonal line, respectively. Panel labels (AK) correspond to datasets listed in Table 2 .
Figure 5
Figure 5. Diverse rank conservation of networks across phenotypes.
Colors on the heatmap represent rank conservation indices for each network in 19 different phenotypes, where brightest indicates very tight regulation of network ranking in a phenotype and darkest indicates loose regulation of networks, with greater shuffling of gene rankings.
Figure 6
Figure 6. Differential rank conservation across all networks for a set of two prostate phenotypes.
Positive rank difference scores predict a metastatic sample and negative difference scores predict a sample as normal.
Figure 7
Figure 7. Differential rank conservation of the MAPK network in metastatic prostate cancer and normal prostate.
(A) Histograms of rank matching scores. MT template matching scores (R (MAPK,MT)) are higher on average in MT samples than NP matching scores (R (MAPK,NP)). In NP samples, R (MAPK,NP) scores are higher on average than R (MAPK,MT) scores. (B) Rank matching scores for the MAPK network. Comparing the two rank matching scores in each sample, MT samples are more similar to the MT template than to the NP template in all cases; NP samples are ranked more similarly to the NP template more than the MT template in all cases. (C) Rank difference score values for the MAPK networks. Samples are classified as MT if the rank difference score is greater than zero and as NP if the difference is less than zero.
Figure 8
Figure 8. Classification with DIRAC compared to other methods.

References

    1. Hood L, Heath JR, Phelps ME, Lin B. Systems biology and new technologies enable predictive and preventative medicine. Science. 2004;306:640–643. - PubMed
    1. Chuang HY, Lee E, Liu YT, Lee D, Ideker T. Network-based classification of breast cancer metastasis. Mol Syst Biol. 2007;3 - PMC - PubMed
    1. Land H, Parada LF, Weinberg RA. Tumorigenic conversion of primary embryo fibroblasts requires at least two cooperating oncogenes. Nature. 1983;304:596–602. - PubMed
    1. Lowe SW, Cepero E, Evan G. Intrinsic tumour suppression. Nature. 2004;432:307–315. - PubMed
    1. Subramanian A, Tamayo P, Mootha VK, Mukherjee S, Ebert BL, et al. Gene set enrichment analysis: A knowledge-based approach for interpreting genome-wide expression profiles. Proc Natl Acad Sci U S A. 2005;102:15545–15550. - PMC - PubMed

Publication types