

doi: 10.1371/journal.pcbi.1000786.
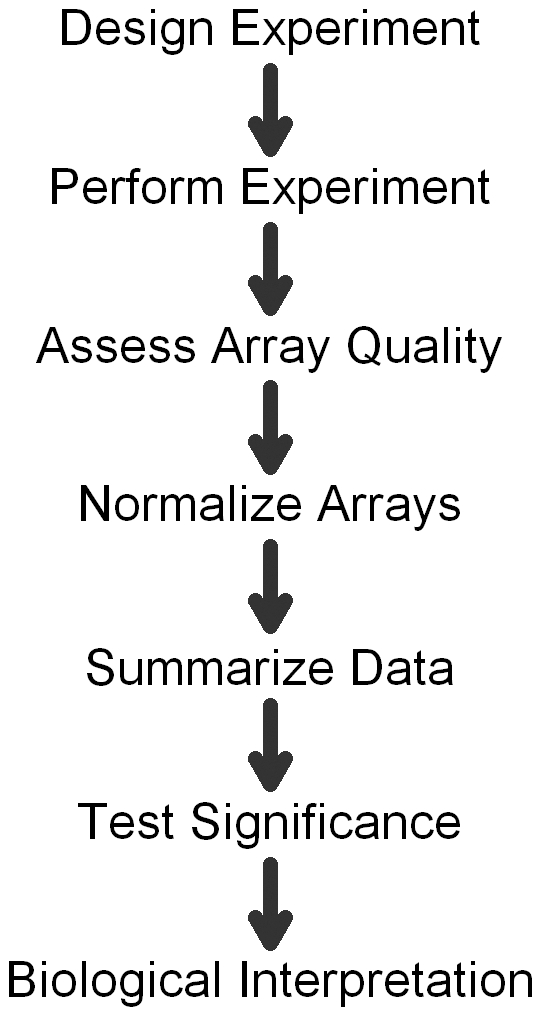
Making informed choices about microarray data analysis
Affiliations
- PMID: 20523743
- PMCID: PMC2877726
- DOI: 10.1371/journal.pcbi.1000786
Item in Clipboard
Making informed choices about microarray data analysis
PLoS Comput Biol.
.
No abstract available
Conflict of interest statement
The author has declared that no competing interests exist.
Figures
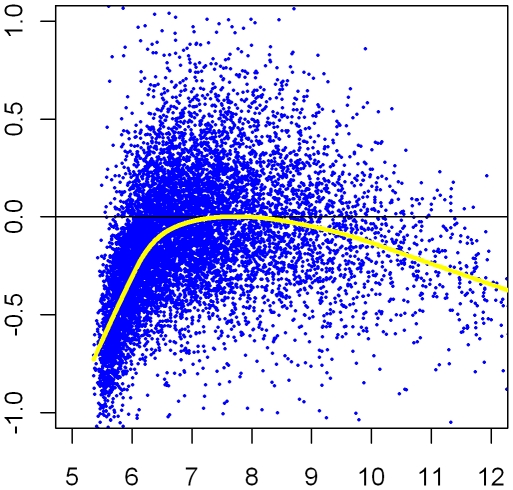
This plot represents deviations of measures from chip GSM25526 (from GSE2552 in GEO) relative to the average across all chips (on the vertical axis) plotted against that average (in log2 units on the horizontal axis) as a technical variable. The black line indicates no trend; a loess fit to the trend is plotted in yellow. Clearly, the deviation of the trend from 0 is bigger than the standard deviation of the variation around the trend, a sign of a significant technical artifact.
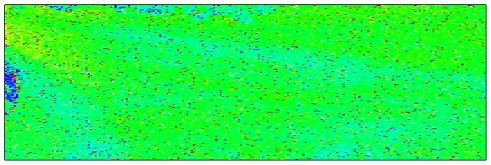
Green pixels represent probes whose value on this array is close to their average values across all samples. Red pixels represent probes whose values are more than 1.41 (square root of 2) times their average values across all samples, while dark blue pixels represent probes whose values are less than 0.71 (reciprocal of square root of 2) times those averages.
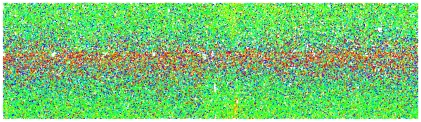
Colors represent how the signal from a particular bead deviates from the average signal from that bead type across the array. The color scale is as for Figure 3.
References
-
- Slonim DK, Yanai I. Getting started in gene expression microarray analysis. PLoS Comput Biol. 2009;5:e1000543. doi: 10.1371/journal.pcbi.1000543. - DOI - PMC - PubMed
-
- Benjamini Y, Hochberg Y. Controlling the false discovery rate: a practical and powerful approach to multiple testing. J R Stat Soc Ser C Ser B. 1995;57:289–300.
-
- Ayroles JF, Gibson G. Analysis of variance of microarray data. Methods Enzymol. 2006;411:214–233. - PubMed
-
- Johnson WE, Li C, Rabinovic A. Adjusting batch effects in microarray expression data using empirical Bayes methods. Biostatistics. 2007;8:118–127. - PubMed
MeSH terms
LinkOut - more resources
Full Text Sources
