. 2010 May 27;6(5):e1000924.
doi: 10.1371/journal.ppat.1000924.

NK cells and gammadelta T cells mediate resistance to polyomavirus-induced tumors

Affiliations

NK cells and gammadelta T cells mediate resistance to polyomavirus-induced tumors

Rabinarayan Mishra et al. PLoS Pathog. .

Abstract

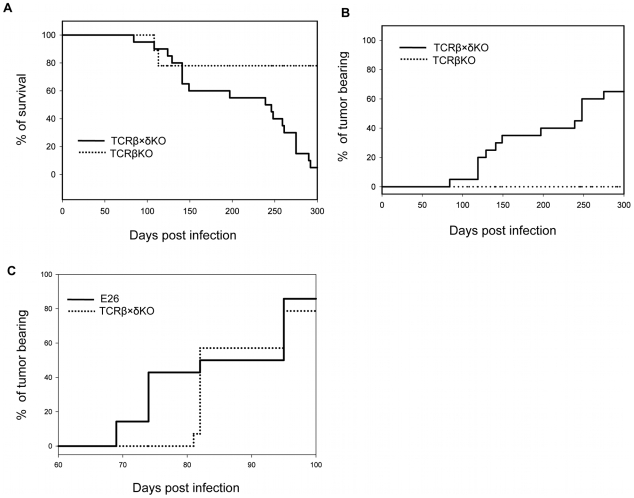
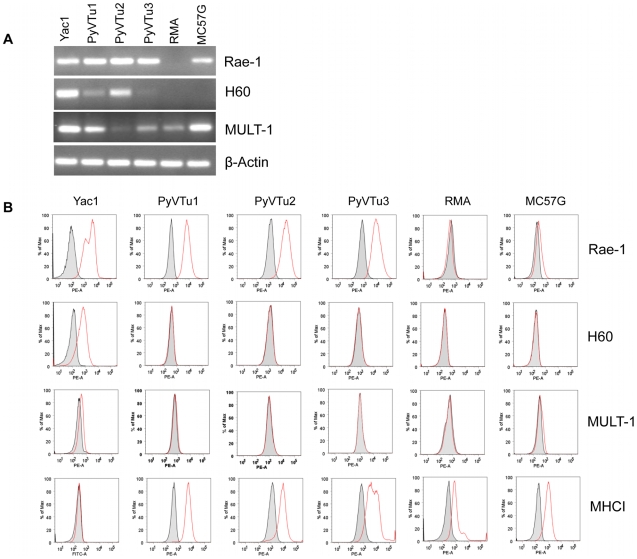
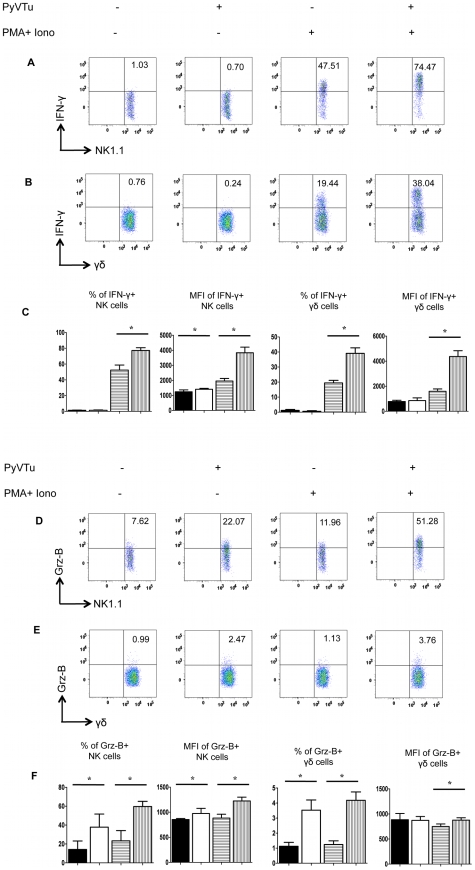
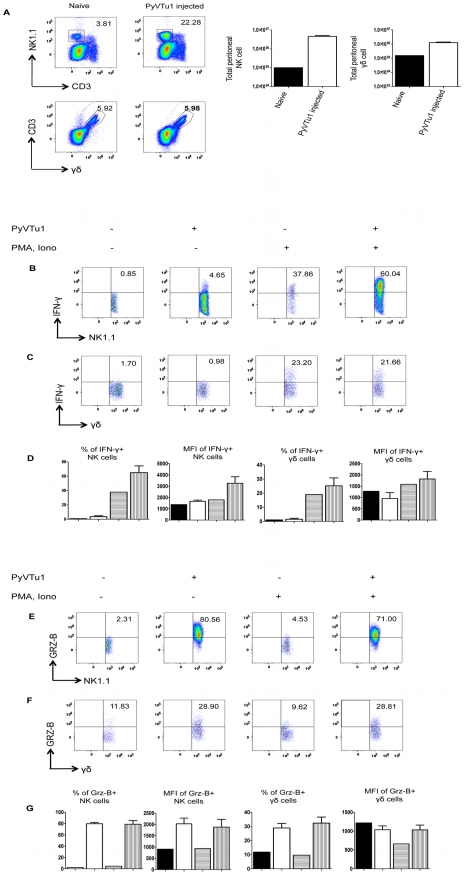
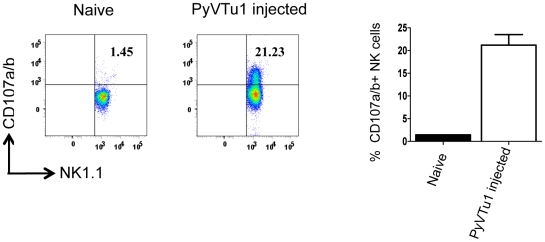
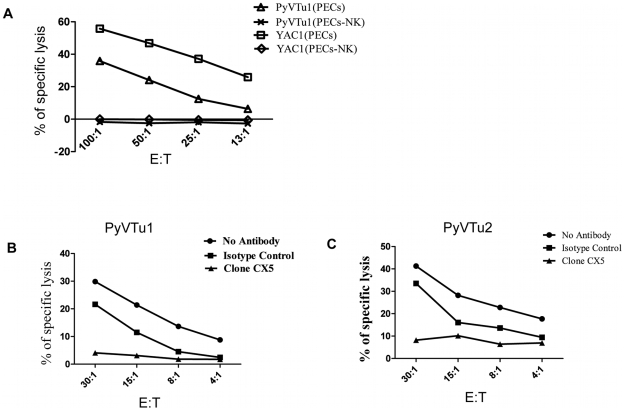
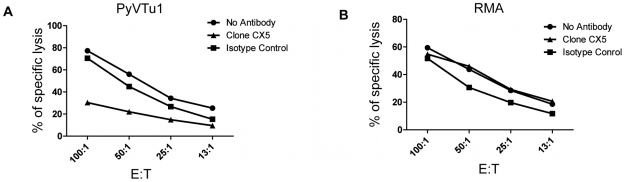
NK and gammadelta T cells can eliminate tumor cells in many experimental models, but their effect on the development of tumors caused by virus infections in vivo is not known. Polyomavirus (PyV) induces tumors in neonatally infected mice of susceptible strains and in adult mice with certain immune deficiencies, and CD8+ alphabeta T cells are regarded as the main effectors in anti-tumor immunity. Here we report that adult TCRbeta knockout (KO) mice that lack alphabeta but have gammadelta T cells remain tumor-free after PyV infection, whereas TCRbeta x delta KO mice that lack all T cells develop tumors. In addition, E26 mice, which lack NK and T cells, develop the tumors earlier than TCRbeta x delta KO mice. These observations implicate gammadelta T and NK cells in the resistance to PyV-induced tumors. Cell lines established from PyV-induced tumors activate NK and gammadelta T cells both in culture and in vivo and express Rae-1, an NKG2D ligand. Moreover, these PyV tumor cells are killed by NK cells in vitro, and this cytotoxicity is prevented by treatment with NKG2D-blocking antibodies. Our findings demonstrate a protective role for NK and gammadelta T cells against naturally occurring virus-induced tumors and suggest the involvement of NKG2D-mediated mechanisms.


Conflict of interest statement

The authors have declared that no competing interests exist.

Figures

Figure 1
Figure 1. Survival and tumor incidence of PyV-infected TCRβ KO, TCRβ×δ KO and E26 mice.
(A) Survival of TCRβ KO and TCRβ×δ KO mice after PyV (2×10⁶ p.f.u., i.n.) infection. (B) Tumor incidence in TCRβ KO and TCRβ×δ KO mice in the same experiment. N = 20 mice per group. (C) Tumor incidence in E26 mice that lack both NK and T cells and in TCRβ×δ KO mice after PyV (2×10⁶ p.f.u., i.p.) infection. N = 15 mice per group. One representative of at least two similar independent experiments is shown.
Figure 2
Figure 2. Viral load in organs of TCRβ KO and TCRβ×δ KO mice at different time points after in PyV infection.
The viral load was determined by qPCR measuring PyV genome copies per µg of organ DNA in samples isolated from salivary glands (A, C) and lungs (B, D) at various time points during acute (A, B) and long-term persistent infection (C, D). N = 3 in (A) and (B), N = 5 in (C) and (D). Open squares: TCRβ×δ KO mice, closed diamonds: TCRβ KO mice, mean +/− s.d. One representative of three independent experiments is shown.
Figure 3
Figure 3. Expression of NKG2D ligands on cell lines established from PyV-induced salivary gland tumors of TCRβ×δ KO mice.
(A) RT-PCR detection of Rae-1, H60, Mult1 and β-actin transcripts in three salivary gland tumor cells lines established from PyV-induced tumors that developed in TCRβ×δ KO mice (PyVTu1, PyVTu2 and PyVTu3), and in YAC-1, RMA and MC57G cell lines. The expression of message for β-actin in the same samples is shown at the bottom panel. (B) Expression of Rae-1, H60, Mult1 and MHC class I proteins on the surface of PyVTu1, PyVTu2 and PyVTu3 cell lines, and also on YAC-1, RMA and MC57G cells. Grey shaded area: staining with isotype controls, open red lines: Rae-1, H60, Mult1 or MHC I-specific antibody staining. The experiment was repeated two (for H60, MHC I) or more (for Rae-1) times with similar results.
Figure 4
Figure 4. Activation of NK cells and γδ T cells by co-culture with PyVTu cells in vitro.
(A) Flow cytometry of intracellular IFNγ staining of spleen cells cultured with or without PyVTu cells and/or PMA and ionomycin stimulation, gated on NK cells (NK1.1+CD3−) and (B) on γδ T cells (γδ TCR+CD3+). The numbers indicate the percentage of IFNγ+ NK or γδ T cells, respectively. (C) Percentages of IFNγ+ NK and γδ T cells and mean fluorescent intensity (MFI) of the IFNγ staining obtained with cultured spleen leukocytes from three individual mice are summarized, mean +/− s.d. values are shown. The filled bars indicate cultures without PyVTu cells and stimulation, the open bars with PyVTu cells, but without stimulation, the bars with horizontal stripes without PyVTu cells, but with stimulation and the bars with vertical stripes with PyVTu cells and PMA and ionomycin stimulation. The asterisks indicate statistically significant (P<0.05) differences determined by student's t test. (D) Intracellular granzyme-B (Grz-B) staining gated on NK cells and (E) γδ T cells in the same experiment. (F) Percentages of granzyme-B+ NK and γδ T cells and MFI of staining. Mean and s.d. of three cultures is shown, the bars are as described for (C). The asterisks indicate statistically significant (P<0.05) differences. The experiments shown were repeated at least twice with similar results.
Figure 5
Figure 5. Activation of NK cells and γδ T cells in vivo by i.p. injection of PyVTu cells.
(A) Percentages (left panel) and numbers (right panel) of peritoneal NK and γδ T cells in TCR β KO mice 3 days after i.p. injection of PyVTu1 (5×10⁶/mouse) cells. PECs of three naive mice that did not receive cells were pooled and analyzed in comparison, PECs from the PyVTu1 cell-injected mice were enumerated individually (n = 3), mean and +/− s.d. is shown. (B) Intracellular IFNγ staining of PEC gated on NK cells and (C) γδ T cells from untreated and PyVTu1 cell-injected TCRβ KO mice from the same experiment with or without PMA and ionomycin stimulation. The numbers indicate percentages of IFNγ + cells. (D) Percentages of IFNγ+ NK and γδ T cells and mean fluorescent intensity (MFI) of IFNγ staining. Filled bars represent pooled sample from 3 naïve mice without stimulation, open bars the mean + s.d. of samples from 3 PyVTu1-injected mice without stimulation, bars with horizontal stripes pooled samples from 3 naïve mice with stimulation and bars with vertical stripes the mean +s.d. of samples from 3 PyVTu1-injected mice with stimulation. (E) Intracellular Grz-B staining of NK and (F) γδ T cells in the same experiment. (G) Percentage of Grz-B+ NK and γδ T cells and mean fluorescent intensity (MFI) of staining. The bars are as described for (D). The experiment shown is one representative of at least 3 independent experiments.
Figure 6
Figure 6. CD107 a/b staining of NK cells from PEC of TCRβ KO mice injected with PyVTu1 cells in-vivo indicates cytotoxic potential.
PECs from 4 untreated (pooled) and from 3 i.p. PyVTu1 cell- injected TCRβ KO mice were harvested three days after tumor cell injection and tested for CD107a/b expression by flow cytometry. The cells were gated on NK1.1+ CD3− NK cells.
Figure 7
Figure 7. NK cell kill PyVTu targets in a NKG2D-dependent manner.
(A) PECs activated in vivo by i.p. injection of PyVTu cells two days prior to harvest were used as effectors, and PyVTu1 and YAC-1 cells were used as target cells in an in vitro Cr release assay. The PECs were derived from TCRβ KO mice or from TCRβ KO mice treated with anti-NK1.1antibodies (PECs-NK). (B and C) NK cells enriched from spleens of uninfected SCID mice were used as effectors against PyVTu1 (B) and PyVTu2 (C) cell targets in the presence of NKG2D blocking (clone CX5) or isotype control antibodies.
Figure 8
Figure 8. NKG2D blocking antibodies prevent killing of PyVTu cells, but not RMA cells targets by activated NK cells in vitro.
In vitro cytotoxicity assays with activated PEC effector cells from TCRβ KO mice and with PyVTu1 (A) and RMA (B) targets in the presence of no antibodies, NKG2D blocking antibody or isotype control antibody. The PEC effectors were activated in vivo by i.p. injection of PyVTu cells two days prior their harvest.

Similar articles

Cited by

References

    1. Zocchi MR, Ferrarini M, Migone N, Casorati G. T-cell receptor V delta gene usage by tumour reactive gamma delta T lymphocytes infiltrating human lung cancer. Immunology. 1994;81:234–239. - PMC - PubMed
    1. Corvaisier M, Moreau-Aubry A, Diez E, Bennouna J, Mosnier JF, et al. V gamma 9V delta 2 T cell response to colon carcinoma cells. J Immunol. 2005;175:5481–5488. - PubMed
    1. Todaro M, D'Asaro M, Caccamo N, Iovino F, Francipane MG, et al. Efficient killing of human colon cancer stem cells by gammadelta T lymphocytes. J Immunol. 2009;182:7287–7296. - PubMed
    1. Takanami I, Takeuchi K, Giga M. The prognostic value of natural killer cell infiltration in resected pulmonary adenocarcinoma. J Thorac Cardiovasc Surg. 2001;121:1058–1063. - PubMed
    1. Coca S, Perez-Piqueras J, Martinez D, Colmenarejo A, Saez MA, et al. The prognostic significance of intratumoral natural killer cells in patients with colorectal carcinoma. Cancer. 1997;79:2320–2328. - PubMed

Publication types

MeSH terms

Substances